Repository navigation
Reproducibility Report
The Reproducibility Report saves your investigation together with a readable account of the analysis. Use it to:
- Reopen an investigation with its data, settings, views, and completed results preserved.
- Include exported visualizations, captions, and an investigation summary in a report.
- Keep a record of the samples, relationships, and calculation settings used for your findings.
All screenshots use fictional samples. Your sample names, counts, and results will depend on your data.
Load your data and arrange the views you want to keep. Complete any calculations whose results you want to include. Saving preserves completed results; it does not run calculations for you.
- Select Reproducibility Report in the top navigation, immediately to the left of Help.
- Review the summary of completed results, stale results, linked notes, and unlinked notes.
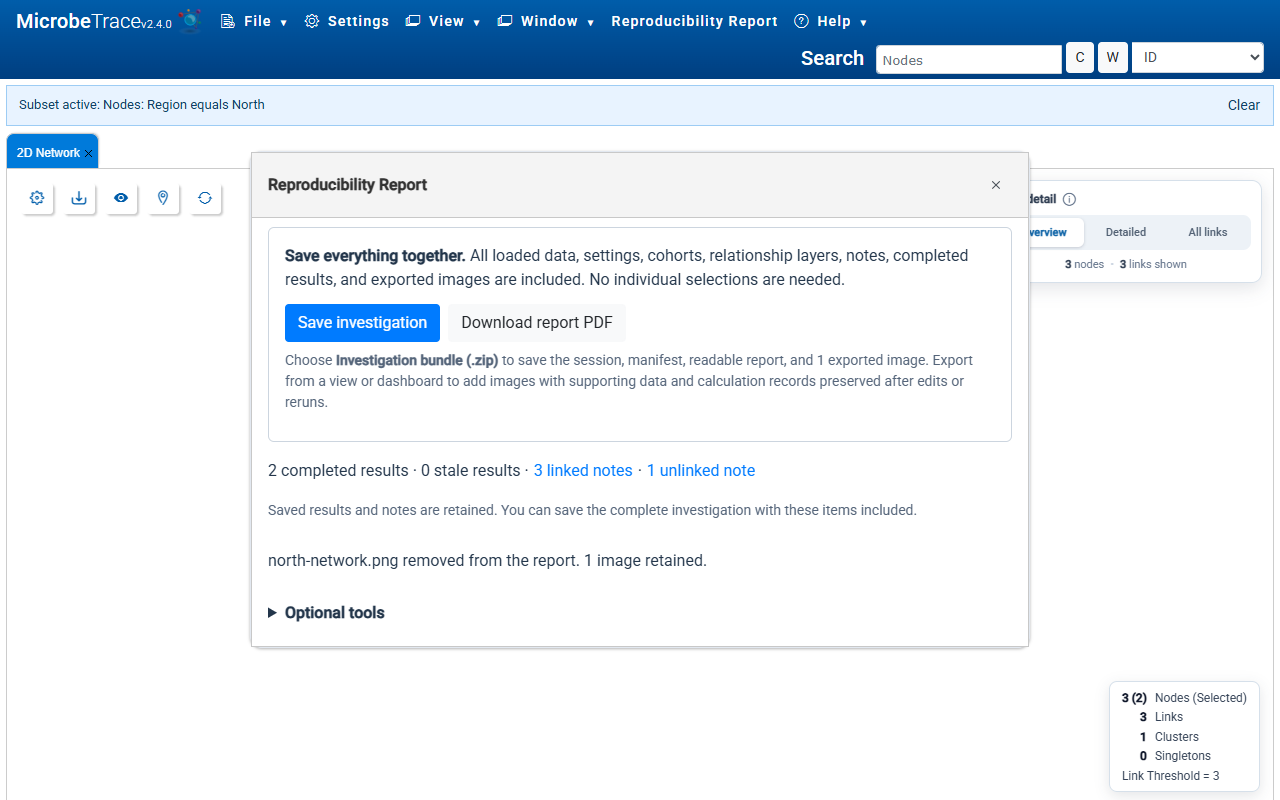
- Select Save investigation.
- Enter a name, keep Investigation bundle (.zip) selected, and select Save.
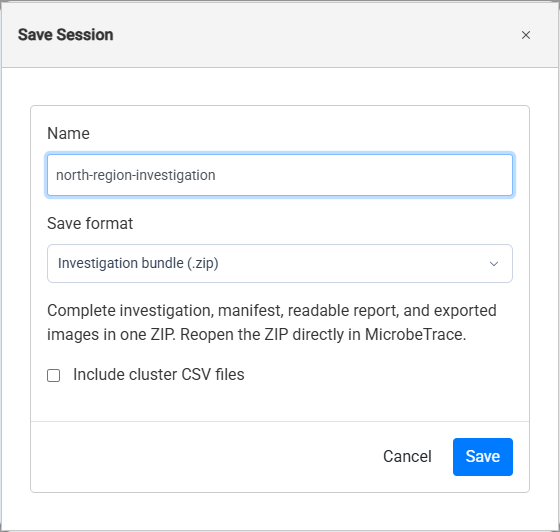
The bundle includes the session, a readable HTML report, detailed audit information, and any images you have exported. Data, threshold, filters, layout, grouping, selection, styling, cohorts, relationship layers, notes, and completed calculation results are saved together. You do not need to select individual features to include.
- To reopen the investigation, use File → Add Data and choose the ZIP, or drop it onto the file-loading area. You can load the ZIP directly without extracting it.
Opening a saved investigation replaces the current one, so save any open work you want to keep first. Reopening restores the saved settings and completed results without running replacement calculations.
File → Save saves the same complete investigation. Reproducibility Report also provides access to report text, exported-image review, and the PDF download.
| Saved content | What is preserved |
|---|---|
| Threshold | The value, distance measure, display format, and nearest-neighbor setting. |
| Filters | Shared node and relationship rules, time filters, exclusions, minimum cluster size, and saved table and view filters. |
| Layout and selection | Dashboard panes and active tabs, view settings, node positions and pinning, selection, styling, and supported pan, zoom, and scroll positions. |
| Grouping | Grouping fields, display settings, collapsed groups, and group membership. |
| Cohorts | Names, exact membership, and the cohorts chosen for calculations. |
| Relationship layers | Sources, names, enabled state, order, and appearance overrides. |
| Notes | Text, targets, and creation and update times, including retained unlinked notes. |
| Calculations | Scope choices, recorded inputs and parameters, completed outputs, and run details. |
| Report content | The title, summary, exported images, captions, image order, and original figure supporting records. |
Loaded analytical data and available source-file contents are included in the portable investigation. Changing your browser window size can change how a reopened layout fits on screen; retained exported images preserve their original appearance.
Set the filters, threshold, labels, colors, and layout you want each image to show. Export each visualization while it shows the analysis you want to document.
- Select the export button in a view. For a network image, this opens Export Network Image.
- Enter a filename, choose an image format such as PNG, JPEG, or SVG, and select Export. You can also use File → Export Dashboard to export the dashboard.
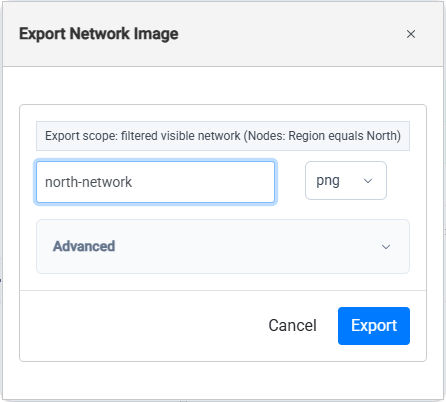
The downloaded image is automatically retained for the report, along with the data and calculation records available when it was exported.
Image retention covers the 2D network, Map, Bubble, Phylogenetic Tree, Heatmap, Alignment View, Gantt Chart, Sankey, Epi Curve, dashboard, and key-table image exports. Use the image formats offered by each view. Data exports such as CSV files do not add an image to the gallery.
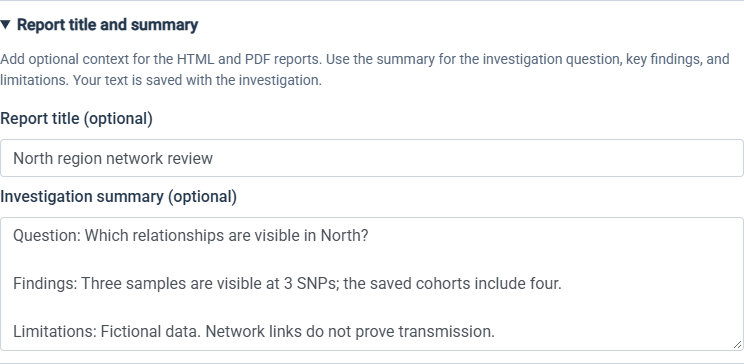
- Open Reproducibility Report → Optional tools → Report title and summary.
- Optionally enter a title and a summary of the investigation question, key findings, and limitations. Both fields accept plain text. Leave them empty to use the default report heading without a summary.
- Open Review exported images. Add an optional title and caption to each image. Use Move up and Move down to change their order, or Remove to leave an accidental export out of future reports.
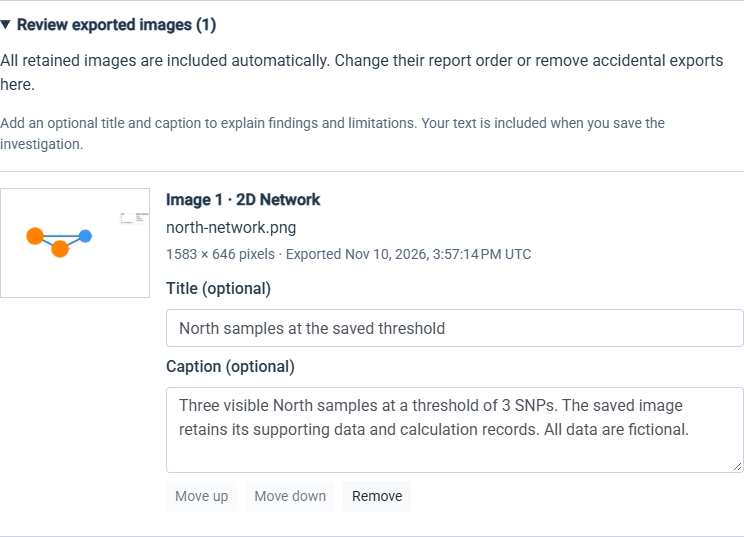
- Select Save investigation and save an investigation bundle again to include the new images and report text.
- Extract the downloaded ZIP and open investigation-record.html in a browser.
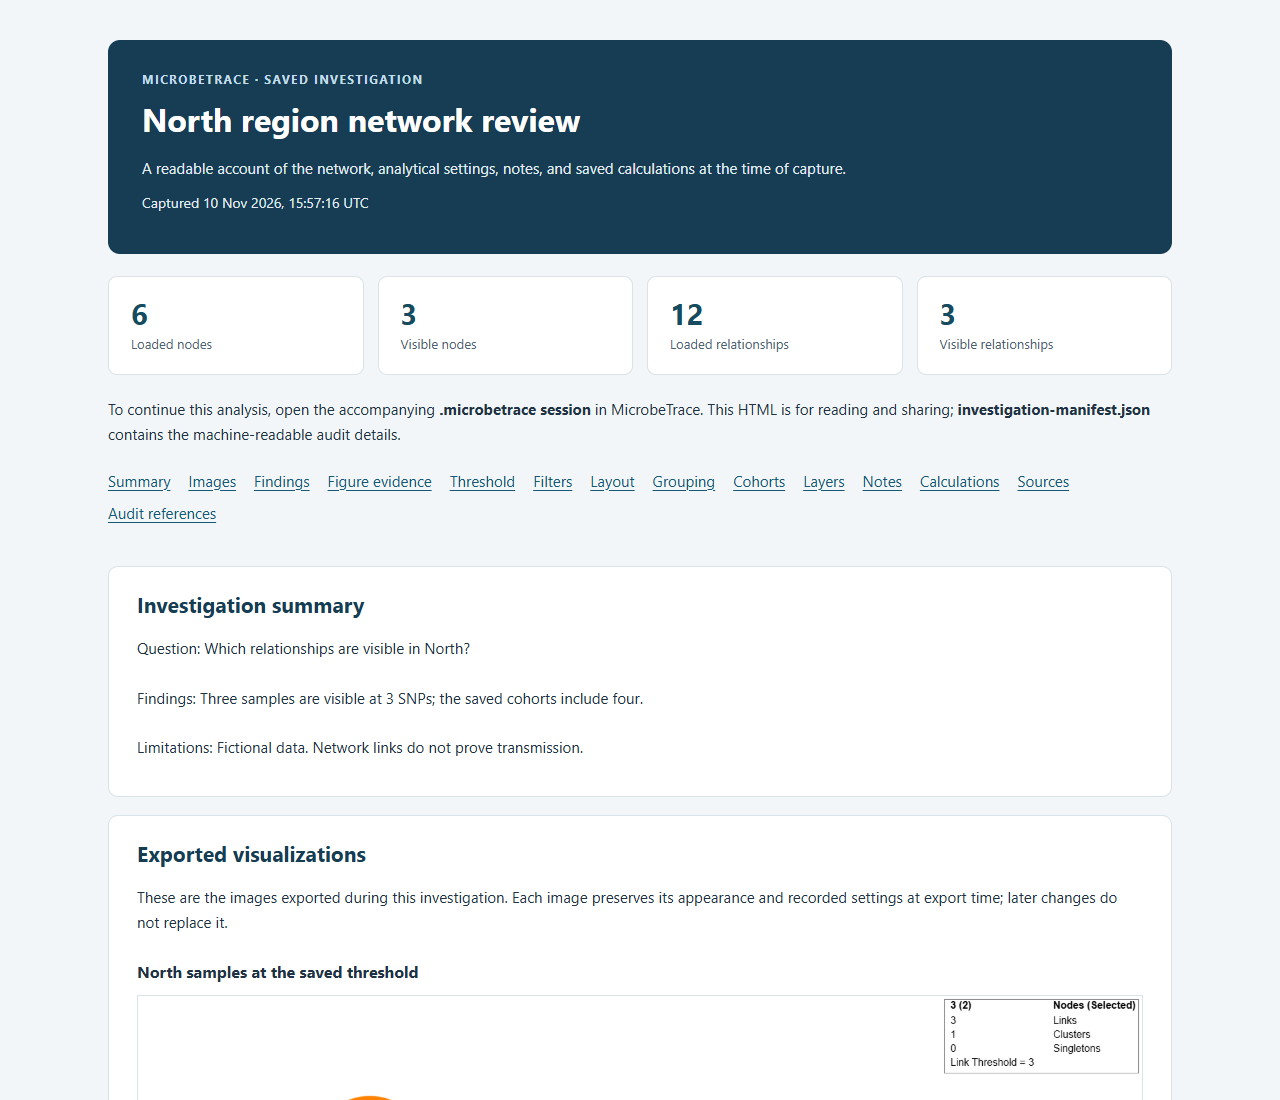
Use the section links to move between the summary, images, findings, filters, cohorts, notes, and other recorded settings. Expand details when you need the exact sample memberships or settings. The HTML report works offline.
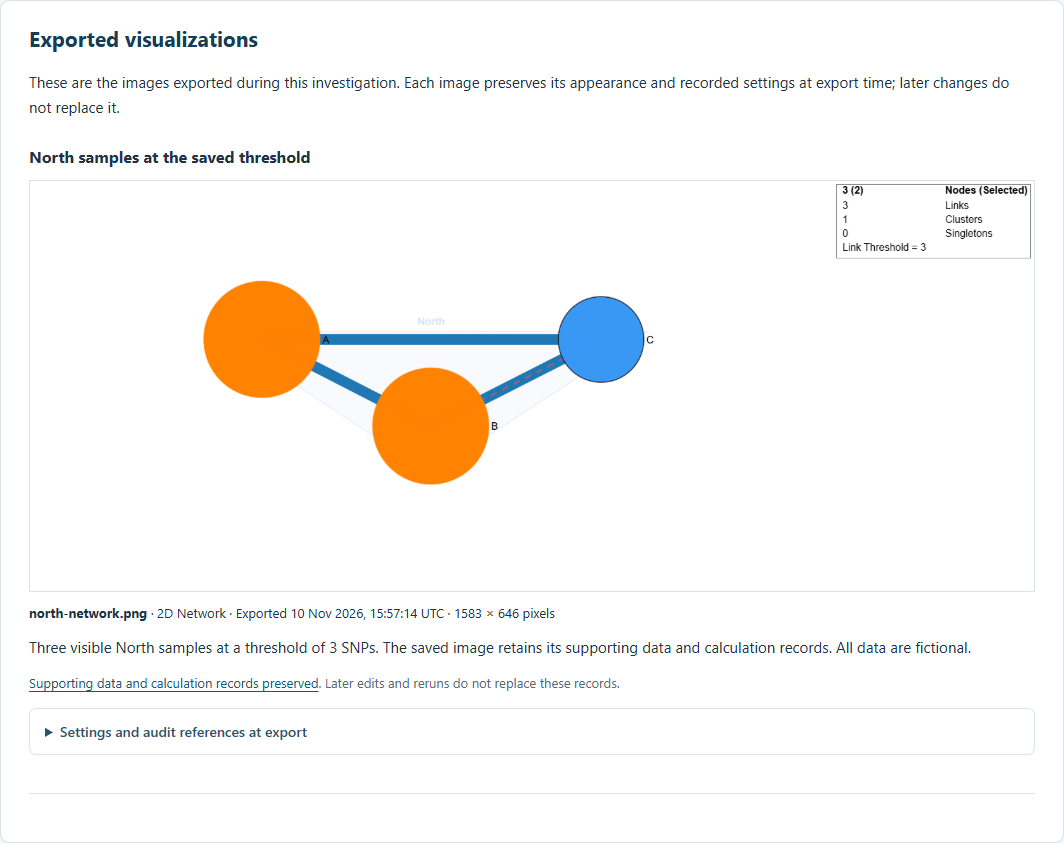
The report preserves each image as it appeared when exported. Later filtering, layout changes, or calculation reruns do not update an earlier image. Export a new image when you want to show the revised analysis.
- Open Reproducibility Report and select Download report PDF.
- Open the downloaded PDF. It includes the report title, summary, exported images and captions, saved findings, and recorded analysis settings.
- Use the Sections index to jump to a section, Back to sections in the page footer to return, and the audit-appendix links for detailed records.
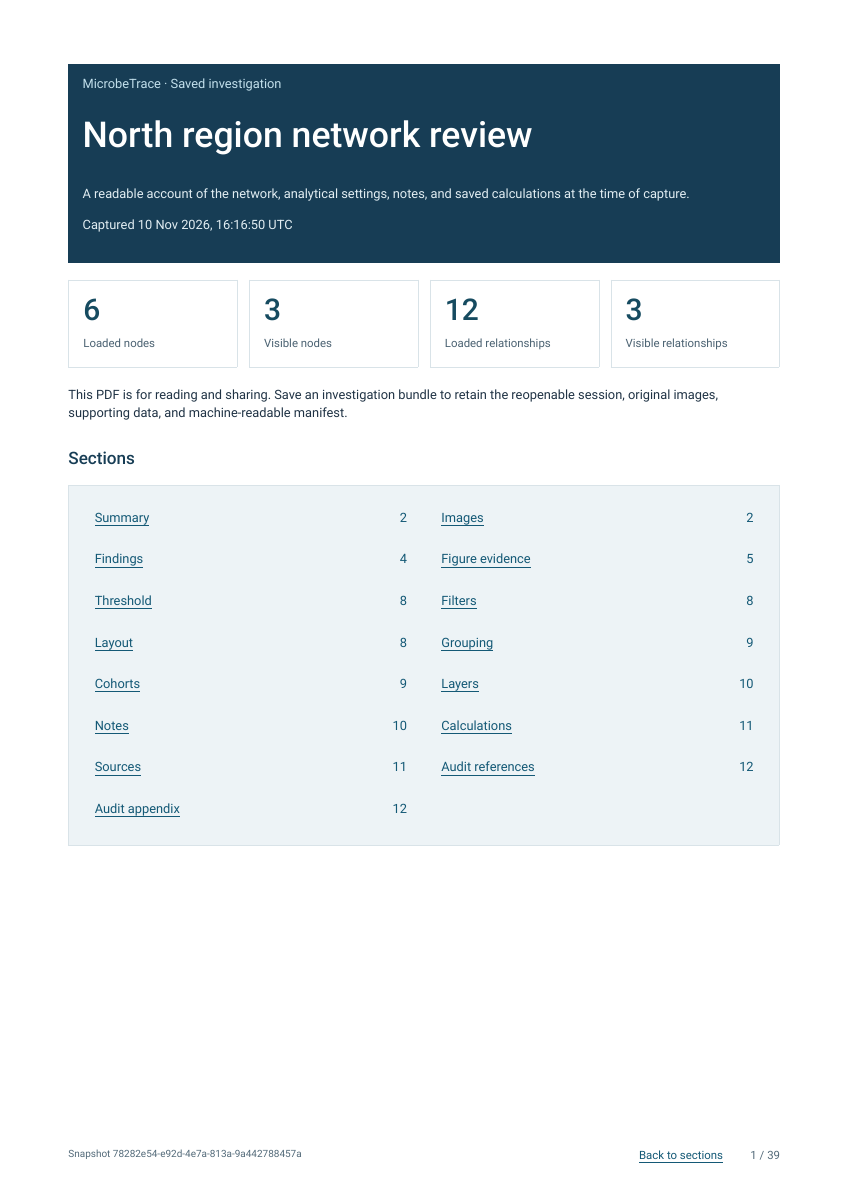
The PDF presents expandable HTML details in a linked Audit appendix. Use Return to report there to go back to the original reference. Original image files and exact supporting data remain in the investigation bundle.
HTML and PDF reports are for reading and sharing. Keep the investigation bundle or .microbetrace session when you want to reopen and continue the analysis. Downloading a report does not rerun calculations.
- Open the HTML report or PDF and follow Findings in its section navigation.
- For Network statistics, check Scope when run, saved input counts, result status, completion time, and the threshold recorded with that result.
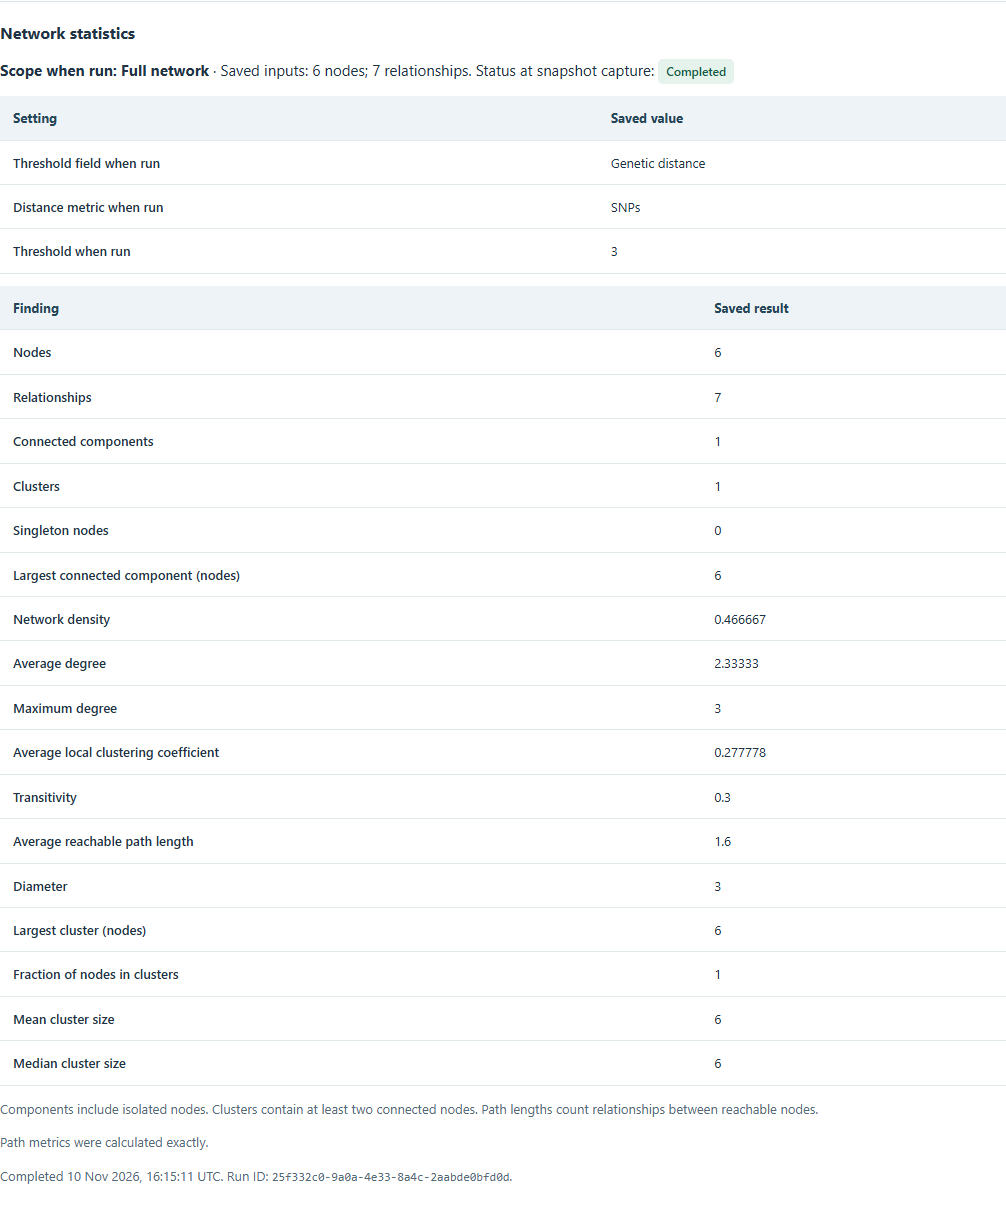
The table includes components, clusters, singletons, density, degree, clustering, and path metrics when recorded. Components include isolated samples; clusters contain at least two connected samples. An approximate label identifies estimated metrics. Displayed decimals are formatted for readability; the saved session retains the recorded output precision.
- For Threshold analysis, review the recorded sweep range and the saved recommendation.
- Expand All saved threshold results to compare the recorded counts and scores at every saved sweep point. In the PDF, follow its audit-appendix link instead.
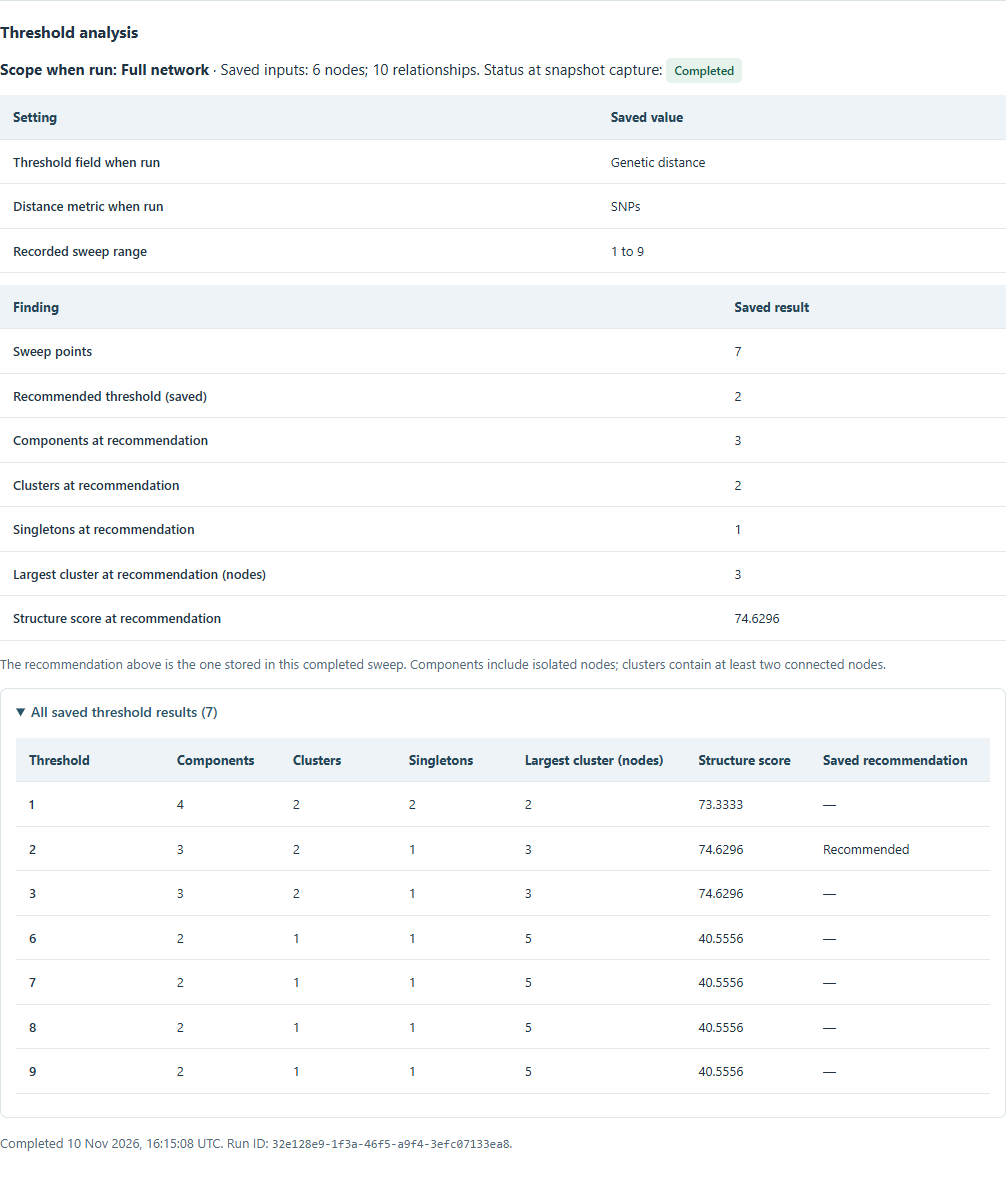
These are results from completed saved calculations. They are not recalculated when you open the report. Not run means no completed result was saved for that operation; Not recorded identifies unavailable historical details.
Counts in the report header describe the loaded and visible graph. Calculation counts describe that run's eligible inputs, so they can differ. Threshold sweeps also consider their recorded range rather than only the currently displayed threshold.
- Follow Images and find the figure you want to check.
- Select Supporting data and calculation records preserved beneath it. This opens Supporting records for exported figures.
- Check the calculation's scope, input counts, saved findings, and status at image export.
- Expand the original-parameter and input-ID details when you need the exact inputs. The supporting record also retains the source data, cohort memberships, relationship layers, and scope choices present at export.
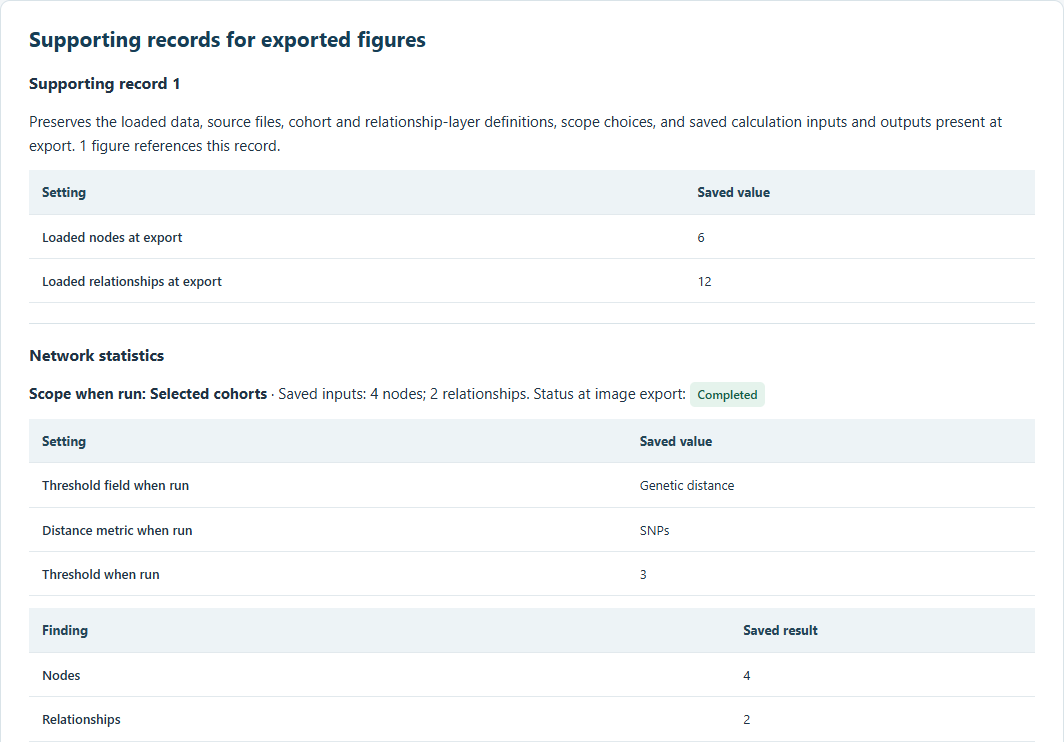
In this example, the current Full-network result uses six samples and seven relationships. The earlier figure still retains its four-sample, two-relationship cohort result. A later run does not supply replacement findings for an earlier image. Images from older sessions can instead say that historical analytical records were not recorded.
- Use Threshold, Filters, Layout, and Grouping to check the saved analytical and display settings. Expand membership or view-setting details where needed.
- Use Cohorts, Layers, and Notes to review saved groups, source availability, and investigation context.
- Under Calculations, distinguish Scope for next run from the scope recorded for an already completed result. Expand its recorded inputs and parameters for the original run details. Bootstrap records include completed replicate counts and early-stopping details when recorded.
- Open Sources and Audit references to find source names, software identity, the snapshot ID, and recorded content checksums.
Report dates are labelled in UTC. The header's capture time, an image's export time, and a calculation's completion time describe different events. Resaving makes a new capture while retaining the original image and calculation times.
The session, manifest, and HTML inside one bundle identify the same snapshot. A later save or a separately downloaded PDF is a new capture and may have a different snapshot ID. Older sessions can still be opened, but saving them cannot recover historical details that were never recorded.
A cohort is a named group with fixed sample membership. Use one when you want to analyze the same group again after changing the displayed filters.
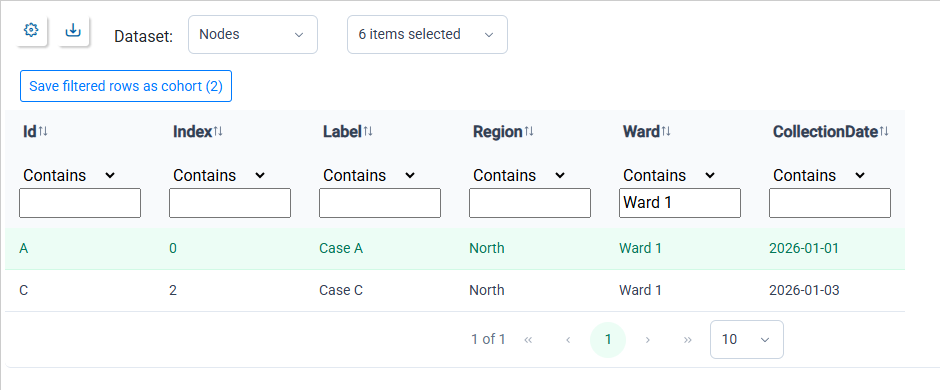
Load node data with the fields you want to filter. In this example, the network already has a Region = North filter, and the table's Ward field is filtered to Ward 1. Two samples match both conditions.
- Open View → Table and choose the Nodes dataset.
- Apply the column filters for the group you want to keep.
- Select Save filtered rows as cohort. The number on the button counts all matching rows, including rows on other pages.
- Review the matching-node count, enter a name such as Ward 1 review, and select Create cohort.
- Open Reproducibility Report → Optional tools → Run or change calculations.
- In Cohorts for calculations, search for the cohort name and select it. Clear other cohort choices if you want to use only this group.
- Set the calculation's scope to Cohort and review its eligible input count before running it.
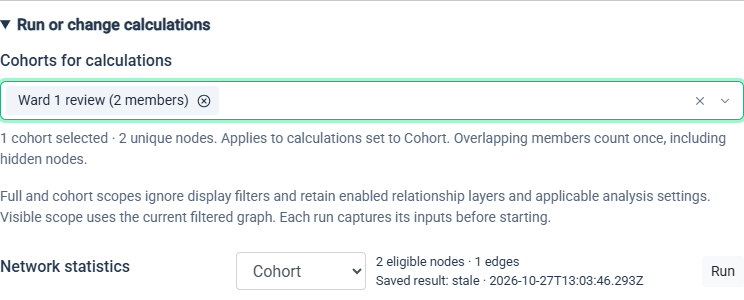
The example previews two eligible samples and one relationship. The previous result is marked stale because the cohort choice changed; it stays available until a replacement run succeeds.
- Select Run when you want to calculate a result for those inputs. Save the investigation afterward to retain the cohort, scope choice, and completed result.
Creating a cohort does not change ordinary node selection or automatically choose it for calculations. Its membership stays fixed when table or network filters change. Under Edit cohorts, you can rename it, select its members, explicitly Replace from selection, or delete it. Create from selection provides another way to make a cohort.
If you select several cohorts, their members form one combined group. Overlapping members count once, and hidden members remain included.
- Open Optional tools → Edit cohorts.
- To create a cohort from an ordinary node selection, select the nodes in a linked view, enter a cohort name, and choose Create from selection. The example below adds Exposure review from three selected samples.
- To rename a cohort, edit its name and click outside the field to apply a valid name.
- Choose Select members to make that cohort the ordinary node selection. You can then adjust the selection in a linked view.
- Choose Replace from selection only when you want the adjusted selection to become the cohort's new fixed membership. At least one node must be selected.
- Choose Delete to remove the cohort definition. This does not delete its nodes; notes targeting the removed cohort are retained as unlinked notes.
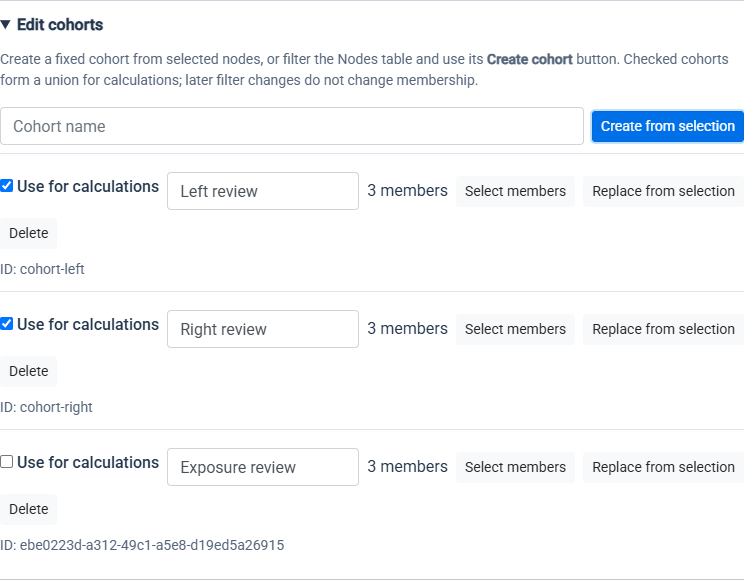
Use for calculations changes the same saved cohort choice as the calculation picker. Select members changes ordinary node selection instead. Neither selecting members nor changing display filters replaces cohort membership automatically. Save the investigation to retain your edits.
Decide whether the note describes the whole investigation or particular nodes, relationships, or cohorts. Notes are plain text and can document methods, follow-up questions, or interpretation.
- Open Reproducibility Report → Optional tools → Edit notes.
- Under Target, choose Investigation, Node, Edge, or Cohort.
- For a specific target type, search the picker by name or ID and choose one or more targets. Hidden items remain available. When shown, Use selected nodes or Use selected edges copies the current selection into the target list; otherwise use the searchable picker.
- Enter the note and select Save note or Save notes (number). Choosing several targets creates a separate note for each.
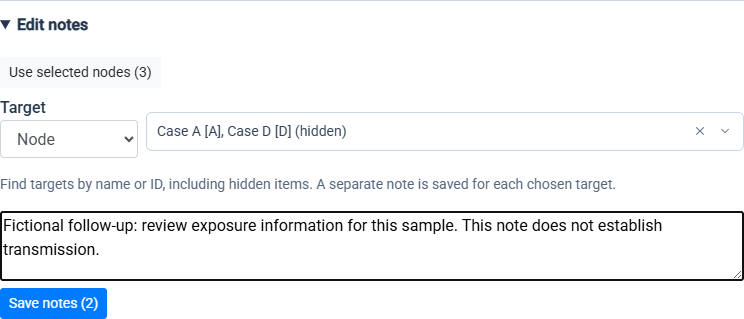
- Use Show notes to display all, linked, or unlinked notes. Search notes matches note text, target names, and IDs.
- Edit a saved note and click outside its text field to apply the change. To remove it, use Delete note; clearing its text alone does not delete the saved note.
- Select Clear filters to return to the full note list, then save the investigation to retain your changes.
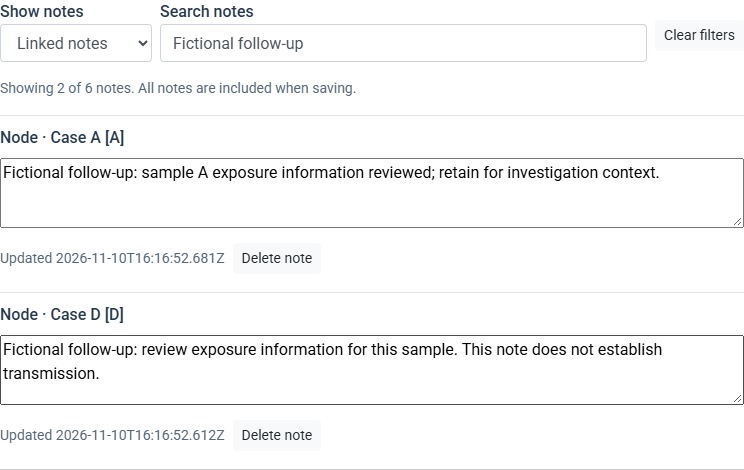
Filtering this list only changes what you see. All retained notes are included when saving. Renaming a target does not move its note to another item; if a target disappears, the note remains with an Unlinked note label. The status-summary note counts are shortcuts into these filtered lists.
Load the relationship sources you want to investigate, such as genetic distances, contact data, or imported relationships. The panel lists sources from the loaded data; import another relationship source when you need to add one.
- Open Reproducibility Report → Optional tools → Edit relationship layers.
- Edit a layer's name to make its purpose clear. Renaming does not change which relationships belong to that source.
- Use Enabled to include or exclude that source from the shared graph and applicable calculations.
- Set its color or Opacity when you want an appearance override. These overrides take precedence over existing view styling.
- Use the up and down arrows to change the layer order. Reset style clears its color and opacity overrides.
- Review any stale-result messages after changing source availability, then save the investigation.
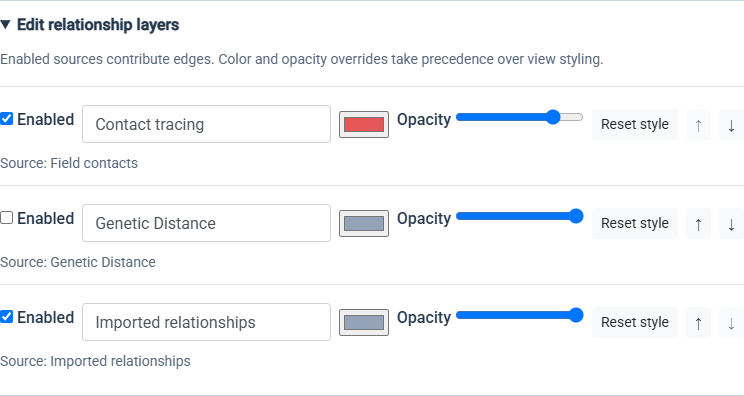
Disabling a layer retains its underlying data. A relationship supported by both genetic and contact sources can remain visible through an eligible enabled contact source after the genetic layer is disabled. A relationship contributed by several sources is counted once.
Each calculation has its own saved scope choice:
| Scope | Samples included |
|---|---|
| Full | All loaded samples, ignoring display filters. |
| Visible | The filtered samples and relationships at the time the calculation starts. |
| Cohort | Members of the chosen cohorts, including hidden members, and eligible relationships between them. |
Enabled relationship layers and applicable analysis settings still apply. Individual calculations also have input requirements; for example, sequence calculations exclude samples without eligible sequences. Review the displayed counts and explanations before selecting Run. An empty cohort or missing prerequisite does not automatically switch the calculation to a larger population.
The controls cover these operations:
| Group | Operations |
|---|---|
| Network and relationships | Network statistics, Threshold analysis, Minimum spanning tree, Nearest neighbors, Directionality. |
| Sequences and distances | Sequence alignment, Sequence ambiguity, Consensus sequence, Consensus distances, Genetic distances, Distance matrix. |
| Trees | Tree inference, Patristic distances, Bootstrap support. |
- Open Optional tools → Run or change calculations and find the operation.
- Choose its scope independently of other operations. For Cohort, select the intended cohorts in the shared picker.
- Review the eligible node, edge, or sequence count and any prerequisite explanation.
- Select Run, wait for the outcome message, and save after a new result completes.
Some operations need more than a non-empty population. Minimum-spanning-tree and nearest-neighbor calculations need eligible weighted relationships. Sequence operations need suitable sequences. Tree inference needs suitable sequence or distance inputs; Patristic distances requires an imported Newick or Auspice tree. Open the Phylogenetic Tree view before running Bootstrap support, which needs eligible sequence inputs and a base tree matching the scoped taxa. A tree or distance-matrix file alone does not supply bootstrap sequence inputs.
Threshold analysis uses its sweep range. Changing a display threshold alone does not restrict that sweep to a single point.
A failed, skipped, or cancelled attempt is not a new completed result. Read its explanation before retrying; an earlier completed output remains available. The panel also identifies reuse of an eligible previously completed tree or distance matrix. A saved result is not refreshed simply by reopening the investigation.
- Completed results are retained calculation outputs.
- Stale results were calculated before a relevant input or setting changed. The previous output stays available. Review Why results are stale, choose the intended scope, and run the calculation again if you need an updated result.
- Linked notes refer to the investigation or a sample, relationship, or cohort that still exists. Hidden targets can still have linked notes.
- Unlinked notes have targets that are no longer present. The notes are retained so their context is not lost. Select the note count to review them.
- Not recorded means an older saved file does not contain that historical information.
Stale results and unlinked notes do not prevent saving.
| Format | Use it for |
|---|---|
| Investigation bundle (.zip) | A portable investigation with the reopenable session, HTML report, detailed audit information, original exported images, and their supporting records. |
| Session (.microbetrace) | The complete investigation in one reopenable file. It retains report text and exported images; choose the bundle for the separate HTML report and original image files. |
| Download report PDF | A readable report with images, colors, section links, and page numbers. Reopen the bundle or session to continue the analysis. |
| Style (.style) | Styling and view settings to reuse with other data. |
| Local link | A bookmark that reopens the saved investigation in the same browser profile and on the same MicrobeTrace site. Clearing site data removes it; use a portable file to move the investigation elsewhere. |
The bundle's investigation-manifest.json contains detailed audit information. It is included automatically; you do not need to open or edit it to use the report.
- Open File → Save, enter a name, and choose Local link under Save format.
- Select Save, then Copy link. Open or bookmark the resulting link in the same browser profile and on the same MicrobeTrace site.
- Save a bundle or session file when you need a portable copy. Clearing site data removes the locally stored investigation.
With Investigation bundle (.zip) selected, optionally check Include cluster CSV files to add cluster exports alongside the complete investigation. The session and report remain complete.
During preparation, wait for the save controls to become available again. Download prepared means MicrobeTrace has handed the file to the browser; use the browser's download list for its location and download status. The notice disappears after five seconds, or you can close it immediately. If preparation fails, the Save dialog keeps the filename and explains the problem so you can retry.
- Optional tools: These controls are for editing and analysis. Everything retained in the investigation is included when saving, even if the tools remain closed.
- Edit relationship layers: Name, enable, disable, reorder, or style existing relationship sources. A relationship supported by several enabled sources is counted once.
- Edit notes: Attach plain-text notes to the investigation, samples, relationships, or cohorts. Search the note list or use the linked and unlinked counts to review a group.
- Report text and captions: These explain your findings without changing completed calculations or the original exported images.
- The report has no images: Export an image from a view or the dashboard, then save another bundle. Images downloaded before image retention was available are not recovered automatically.
- An image shows an earlier filter or layout: That is the preserved export. Export the revised view and review the image list before saving again.
- A saved result is stale: A relevant input or setting changed. Check the explanation and scope before deciding whether to rerun it.
- Cohort scope has no eligible inputs: Select one or more cohorts and check the calculation's requirements. Changing display filters does not add members to an existing cohort.
- A note is unlinked: Its target is no longer present. Review the retained note under Edit notes.
- A local link does not work in another browser: Local links depend on the original browser profile and site. Transfer a bundle or session file instead.
-
The HTML or PDF does not reopen the analysis: Load the complete ZIP or
.microbetracesession in MicrobeTrace. The HTML and PDF are readable reports.
The report preserves completed results and their recorded inputs. It does not provide a chronological history of every action or promise identical reruns across different software versions.