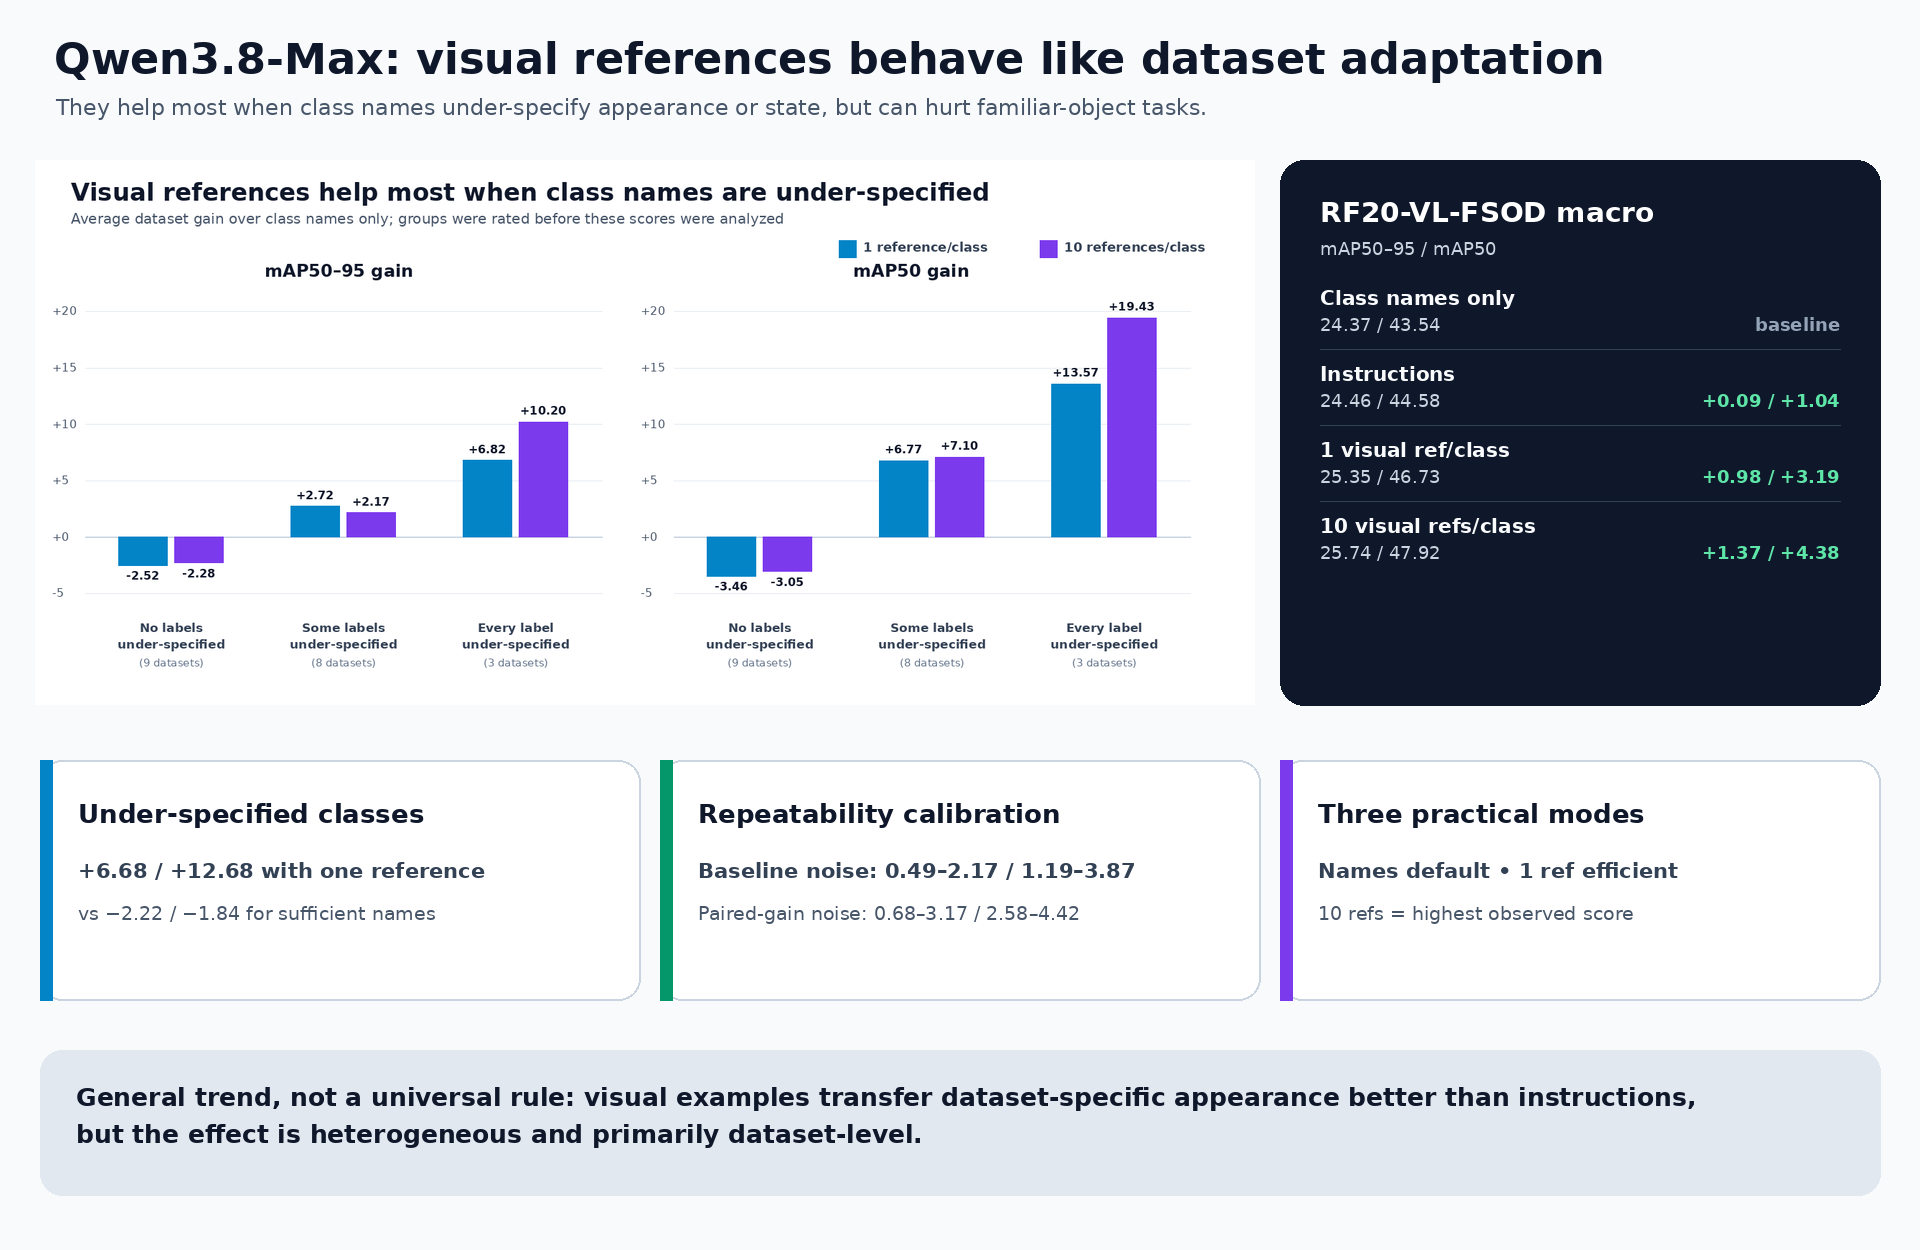
Finding: Qwen3.8-Max does not benefit reliably from adding more context everywhere. Visual references provide substantial, above-noise gains when class names under-specify appearance, state, or annotation semantics, but offer little benefit and can hurt when names already identify familiar objects. Instructions are understood, but visual examples generally transfer dataset-specific appearance more effectively.
The practical choices are class names only as the simplest default, one visual reference per class as the efficient adaptation mode, and ten references per class as the accuracy-maximizing mode measured here. Ten references achieved the highest RF20 score, but its small lead over one reference is within the measured noise proxy and costs about 3.4× as much.
We evaluated one multi-class request per test image on all 20 RF20-VL-FSOD
datasets: 3,970 images, reasoning off, temperature 0, fixed seed, normalized
0–1000 XYXY reference boxes, and COCO maxDets=500 scoring.
Every score pair in this report is mAP50–95 / mAP50; higher is better. A
gain is the prompted score minus the class-names-only score on the same
dataset.
Temperature 0 and a fixed seed did not make the hosted API deterministic. We therefore ran six complete, matched passes on three of the larger datasets and measured two kinds of run-to-run variation:
| Dataset | Test images | Names-only score noise | One-reference gain noise |
|---|---|---|---|
| Actions | 409 | 0.49 / 1.19 | 0.68 / 2.58 |
| Paper Parts | 500 | 0.95 / 3.87 | 3.01 / 3.86 |
| Defect Detection | 188 | 2.17 / 2.89 | 3.17 / 4.42 |
Each value is a conservative repeatability threshold: the larger of the observed six-run range and the estimated 95% repeatability limit. Names-only score noise is how much an unchanged baseline moved between runs. One-reference gain noise is how much the measured difference between the reference and baseline conditions moved; it is the relevant threshold when judging a reference gain. Across these datasets, that threshold ranged from 0.68–3.17 mAP50–95 and 2.58–4.42 mAP50.
These values are a calibration range, not a measured RF20-wide noise floor, because all 20 datasets were not repeated. The three datasets were initially selected because they were relatively large and had positive reference gains, so they establish whether those particular gains repeat, not how often gains occur. The exact threshold definition and six-run results are in the noise study.
Scores are dataset-macro mAP50–95 / mAP50.
| Context given to Qwen3.8-Max | mAP50–95 | mAP50 | Gain vs. names | List-price estimate for this run* |
|---|---|---|---|---|
| Class names only | 24.37 | 43.54 | baseline | $22.28 |
| Annotator instructions | 24.46 | 44.58 | +0.09 / +1.04 | $26.21 |
| 1 positive visual reference/class | 25.35 | 46.73 | +0.98 / +3.19 | $34.20 |
| 10 positive visual references/class | 25.74 | 47.92 | +1.37 / +4.38 | $116.79 |
*How the cost estimates were audited
These are reproducible list-price estimates, not invoice totals. Each API response recorded total input tokens, implicit-cache-hit input tokens, and output tokens. We applied the model-specific rates published for Qwen3.8-Max: $2/M uncached input, $0.25/M implicit-cache input, and $6/M output.
| Context | Uncached input | Cache-hit input | Output | Calculated estimate |
|---|---|---|---|---|
| Class names only | 5.333M | 0.004M | 1.936M | $22.28 |
| Annotator instructions | 7.388M | 1.302M | 1.851M | $26.21 |
| 1 visual reference/class | 6.946M | 39.046M | 1.757M | $34.20 |
| 10 visual references/class | 8.695M | 354.710M | 1.788M | $116.79 |
The formula is (uncached input × $2 + cache-hit input × $0.25 + output × $6) / 1M. The cache documentation
confirms that cached_tokens is part of the reported input-token total, which
is how the calculation treats it.
Actual invoices or future reruns can differ because implicit-cache hits are not guaranteed, provider prices and promotions can change, and subscription credits may alter effective spend. The estimate also excludes 31 failed API attempts across 19,850 condition-image tasks that returned no billable-usage metadata; most were provider-side image download or content-rejection errors.
Recorded sources: class names and one reference, instructions, and ten references.
Compared with the repeatability range above, instructions are within noise, one reference is borderline in the RF20 macro, and ten references only approach the upper end of the proxy range for mAP50. The macro average hides the main finding: the direction and size of the effect depend strongly on the dataset.

Before the instruction study was scored, we rated each of the 110 class names using only the label text. A class was marked under-specified when its name alone did not clearly identify the intended visual target or annotation meaning. The exact 110 ratings and criteria are in the locked label-sufficiency file.
The most direct dataset-level comparison is:
| Pre-rated dataset group | Datasets | Instructions | 1 visual reference/class | 10 visual references/class |
|---|---|---|---|---|
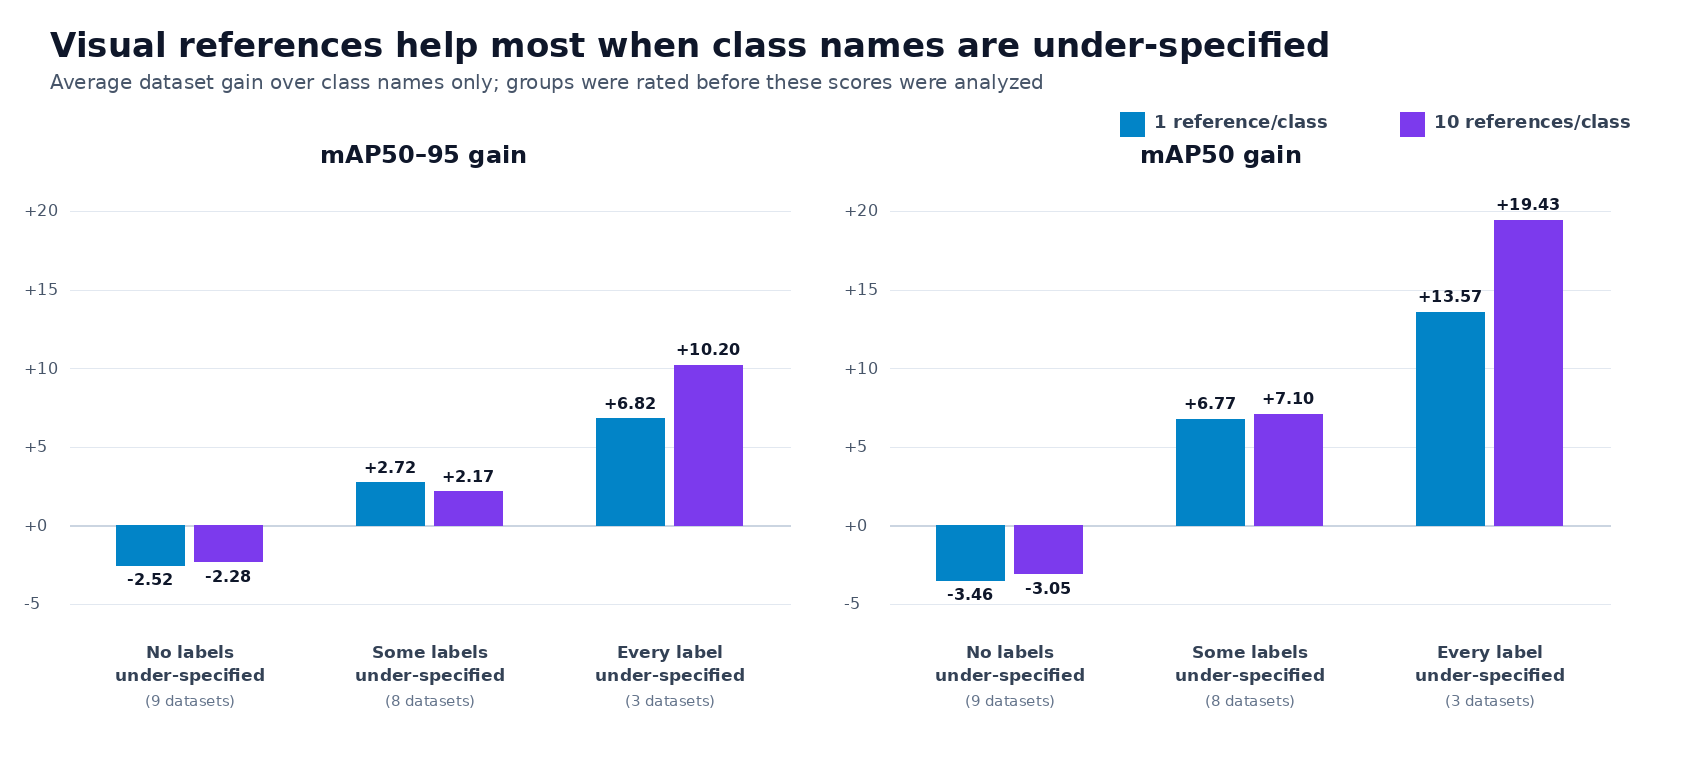
| No class names under-specified | 9 | −2.89 / −4.42 | −2.52 / −3.46 | −2.28 / −3.05 |
| Some class names under-specified | 8 | +2.11 / +4.86 | +2.72 / +6.77 | +2.17 / +7.10 |
| Every class name under-specified | 3 | +3.59 / +7.24 | +6.82 / +13.57 | +10.20 / +19.43 |
Each cell is the average dataset gain over class names only, not a correlation. Datasets with no under-specified labels regressed on average. Datasets with a mixture of sufficient and under-specified labels improved. In the three datasets where every label was under-specified, ten references produced the largest observed gain.
The class-level comparison shows the same separation:
| Pre-rated class group | Classes | 1 visual reference | 10 visual references |
|---|---|---|---|
| Name alone is under-specified | 47 | +6.68 / +12.68 | +6.57 / +13.88 |
| Name alone is sufficient | 63 | −2.22 / −1.84 | −3.89 / −4.97 |
| Requires state, role, or scene context | 37 | +8.37 / +13.91 | +8.76 / +15.16 |
| Does not require state, role, or scene context | 73 | −1.86 / −0.48 | −3.57 / −3.04 |
These are direct average class gains. After resampling complete datasets rather than treating their classes as independent, the gain for under-specified classes remained above zero on both mAP50–95 and mAP50 with either one or ten references. The exact mAP50–95 gap between the two class groups was less certain; that does not mean the observed under-specified-class gain was unclear. The strongest evidence is still for mAP50, suggesting that references improve recognizing what should be detected more consistently than exact localization at stricter IoU thresholds.
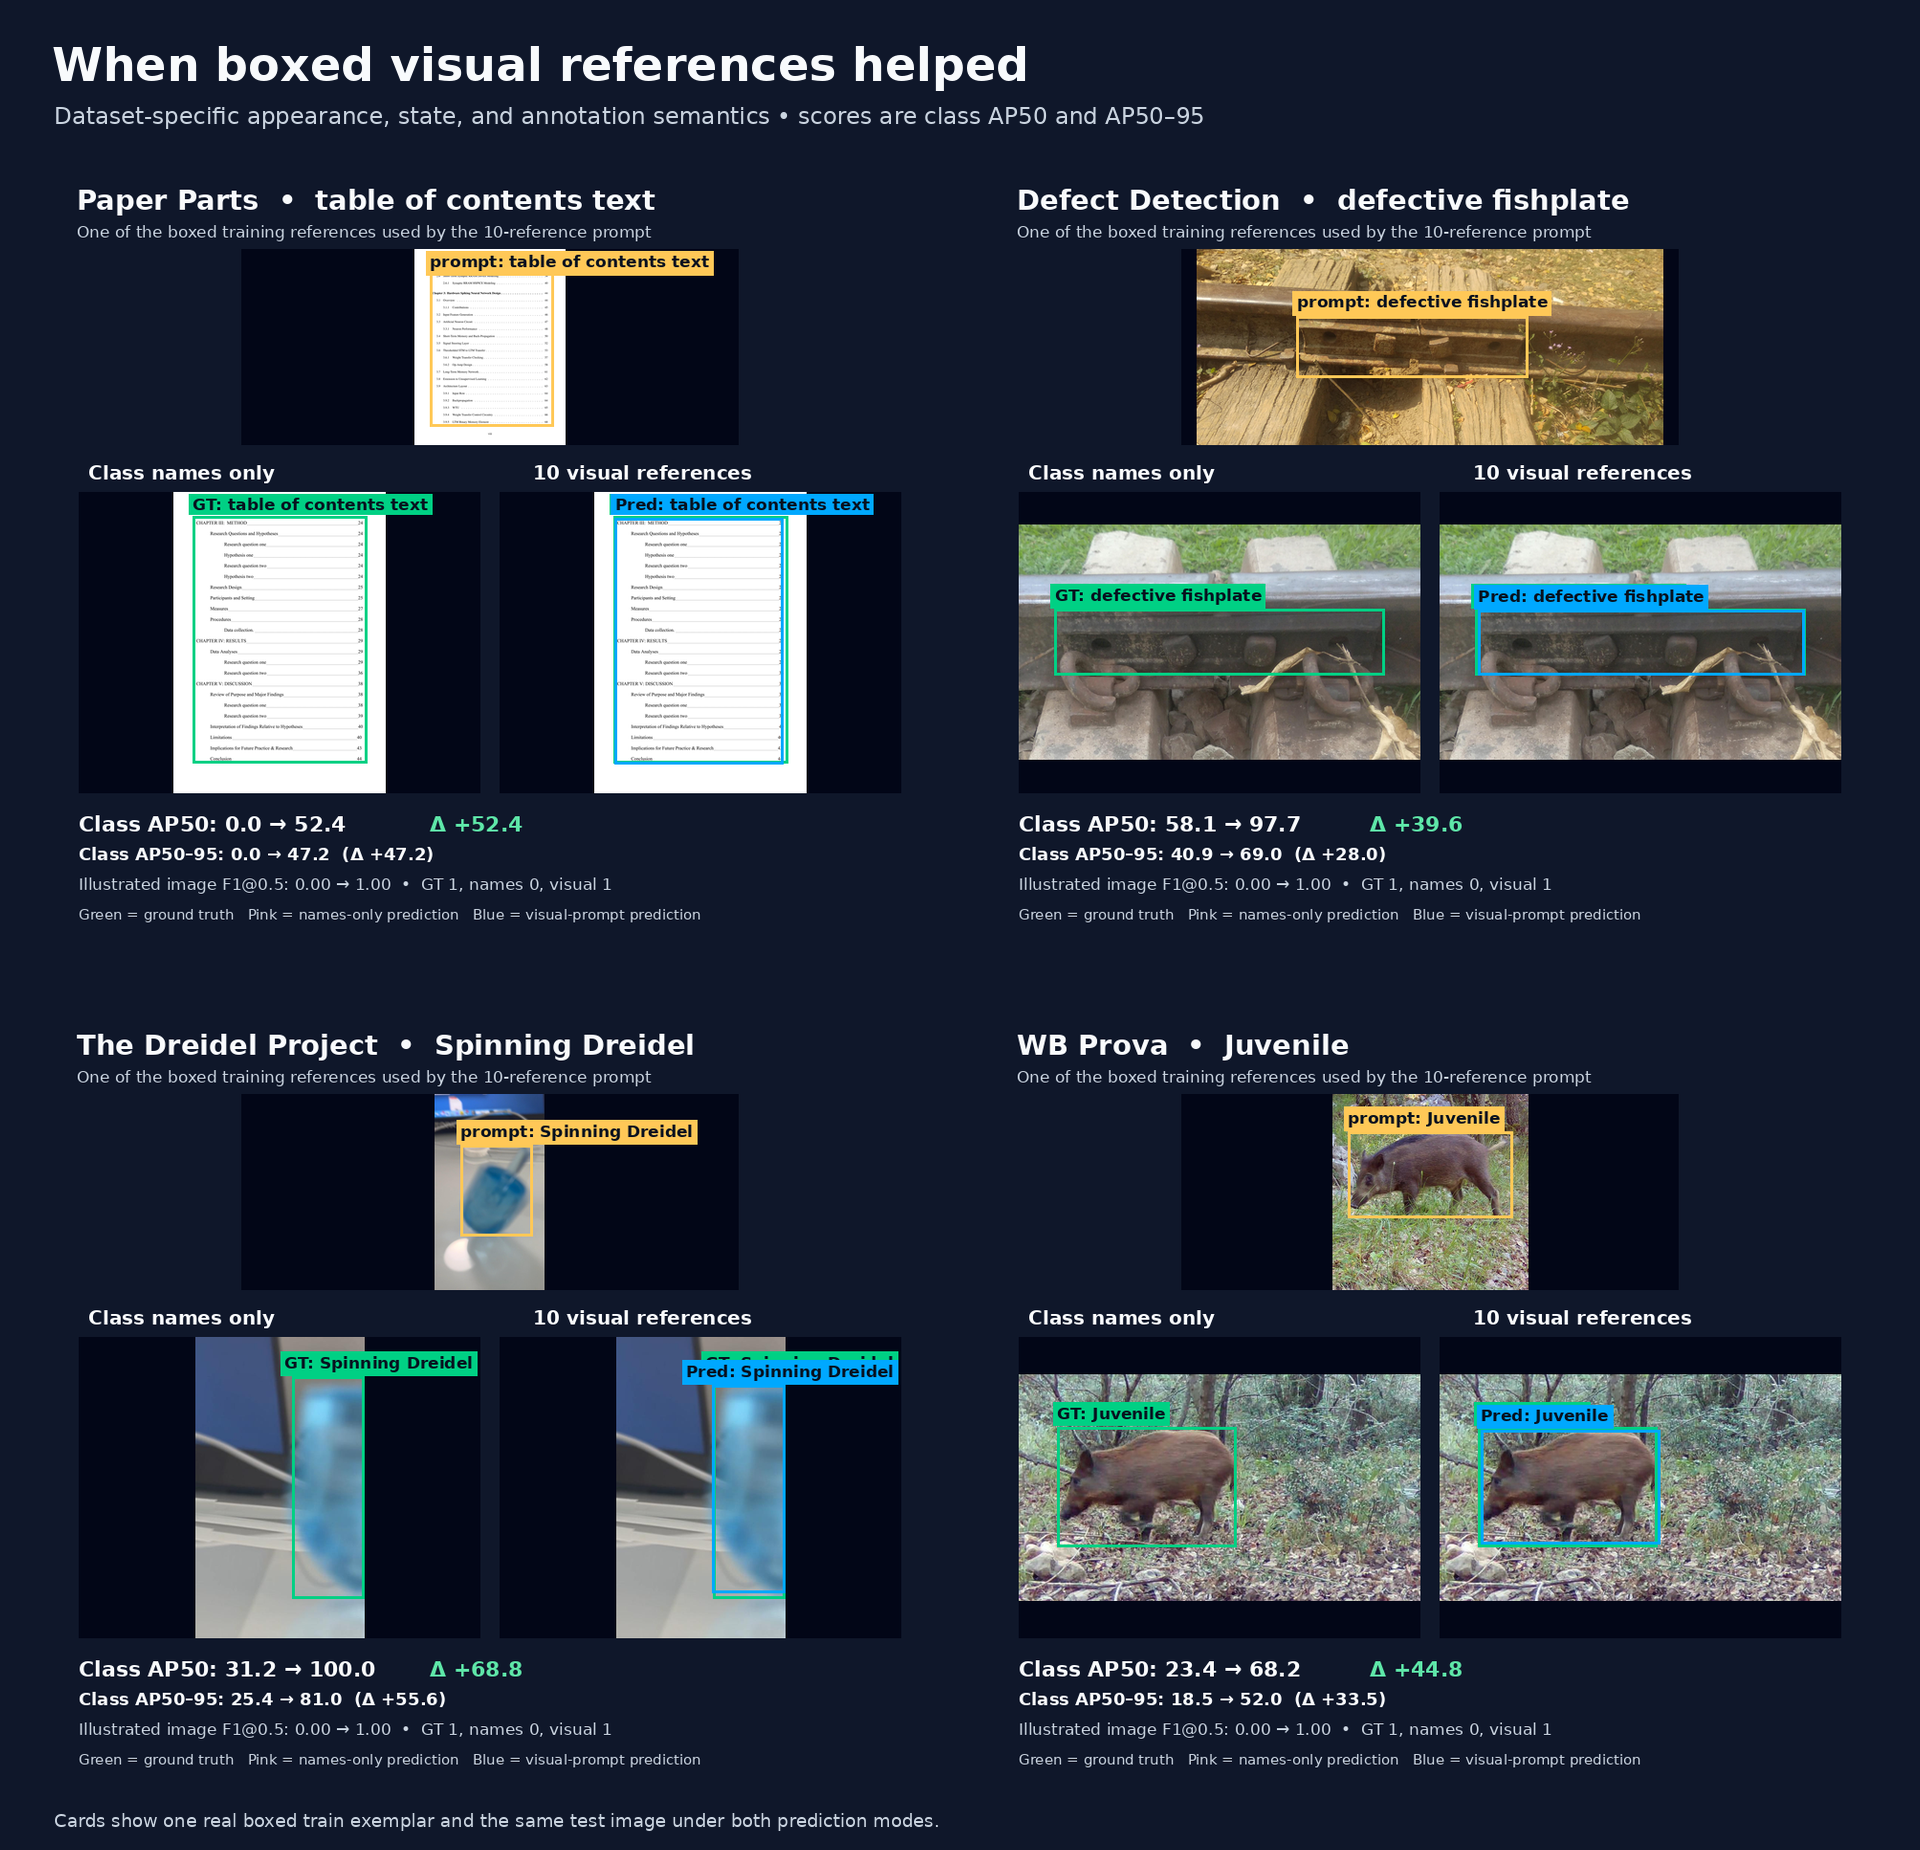
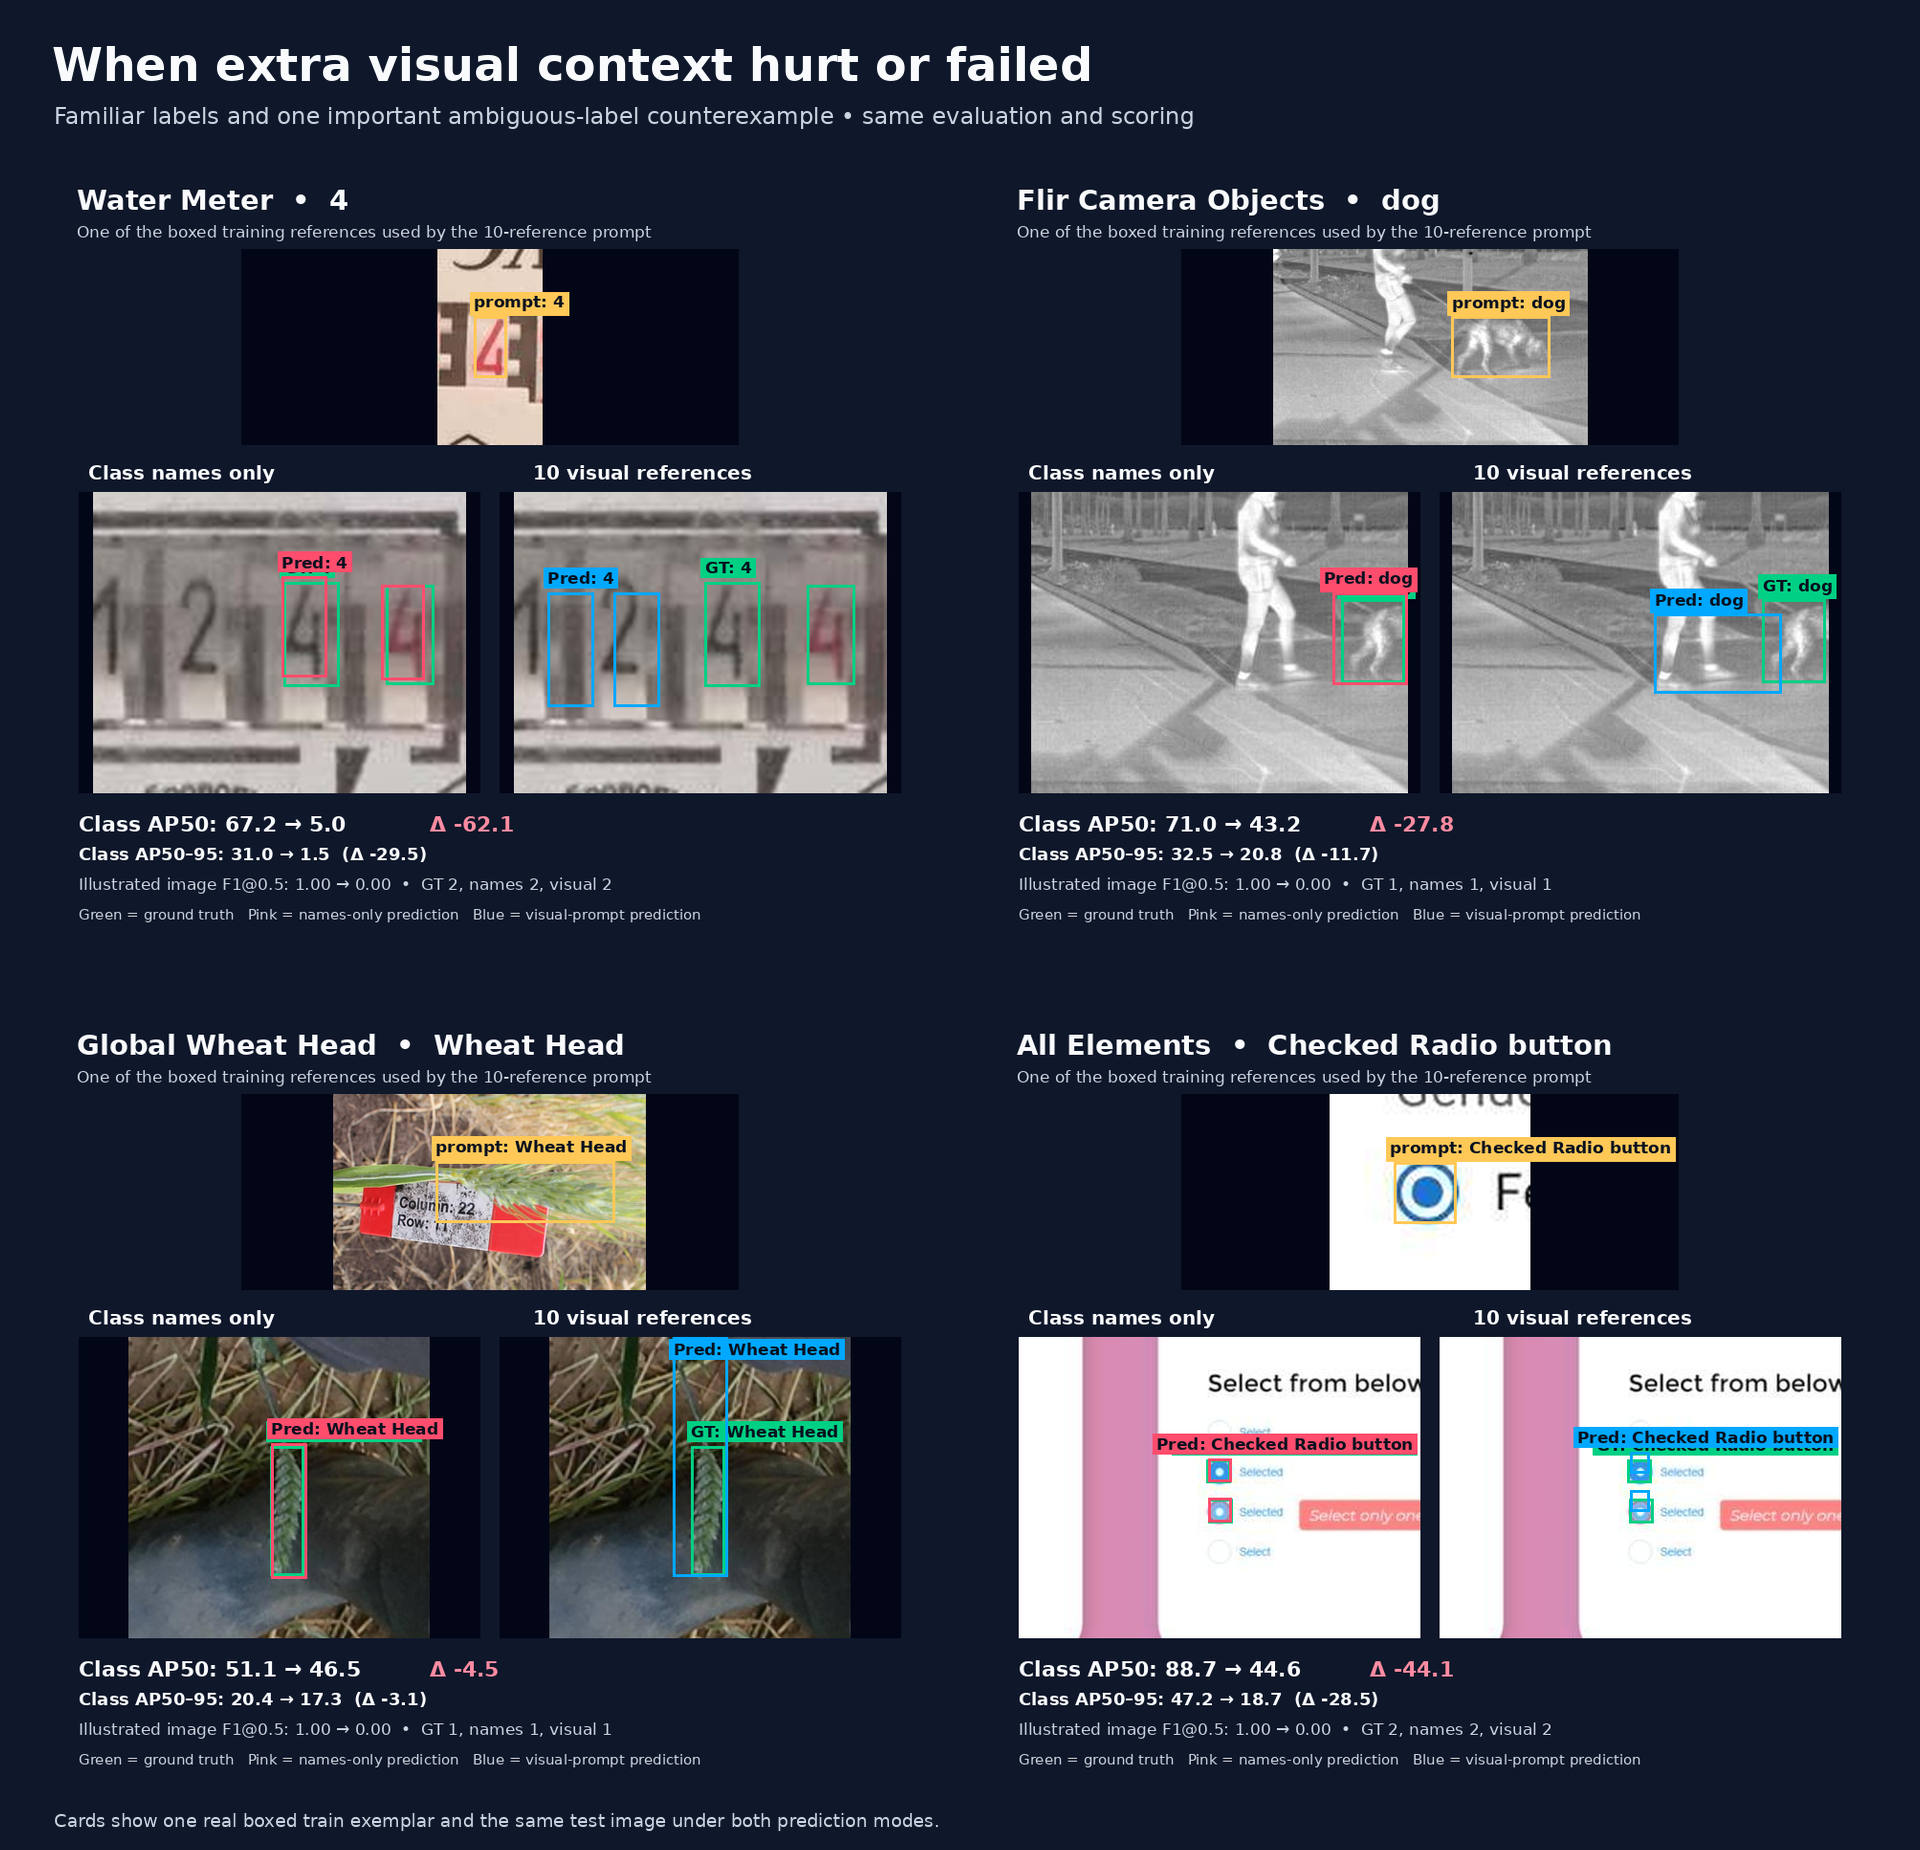
These cards use actual RF20 train and test images. Yellow is one of the boxed training exemplars in the ten-reference prompt. Each target image is shown with the same green ground truth and either names-only predictions in pink or visual-prompt predictions in blue.
 |
 |
 |
 |
 |
 |
 |
 |
The largest dataset-level ten-reference gains align with dataset-specific concepts: animal age groups +17.51 / +24.32, railway defects +11.25 / +18.85, Dreidel states and symbols +10.71 / +22.26, document components +9.73 / +16.13, and smoke +5.06 / +18.90.
 |
 |
 |
 |
 |
 |
Ten references regressed on digits −20.57 / −41.40, thermal-camera objects −3.85 / −7.24, fish and other aquarium animals −3.32 / −0.34, and wheat heads −3.12 / −4.54. The corresponding labels already describe recognizable object identities, leaving less useful ambiguity for an exemplar to resolve.
All Elements is the clearest counterexample. Its UI labels can require state or annotation semantics, yet ten references regressed by −12.39 / −12.77.

Within datasets containing both simple and under-specified classes, class-name sufficiency alone did not consistently identify the winning class. The finding therefore supports dataset-level routing, not an automatic per-class rule.
The RF20 macro increases in the order class names → one reference → ten references, but that ordering is not universal: it holds strictly on only 7/20 datasets for mAP50–95 and 10/20 for mAP50. Ten references are only +0.40 / +1.20 above one reference in the RF20 macro, which is within the measured noise proxy, despite costing over 3× as much.
This is strong exploratory evidence, not a prospective causal result. The ratings themselves were assigned without viewing scores, but the hypothesis was motivated by earlier visual-prompt results. A new semantic-control run is needed for confirmation.
The six matched passes confirmed that one-reference gains were much larger than run-to-run variation on Paper Parts and Actions. Defect Detection stayed positive, but its one-reference gain remained within the paired-gain noise threshold shown at the beginning of this report.
| Dataset | Six-run mean one-reference gain | Paired-gain noise | Judgment |
|---|---|---|---|
| Actions | +2.22 / +4.98 | 0.68 / 2.58 | Clearly above noise |
| Paper Parts | +13.43 / +20.07 | 3.01 / 3.86 | Clearly above noise |
| Defect Detection | +2.03 / +3.60 | 3.17 / 4.42 | Within noise |
Instructions are not ignored. In a six-dataset control, the correct dataset-specific instructions beat instructions shuffled from other classes by +4.38 / +8.25. The model was therefore using their content, not merely reacting to a longer prompt. However, correct instructions still scored −2.97 / −4.13 below class names alone on this matched subset, so they were not a reliable universal addition.
All six-dataset instruction-control scores
| Six-dataset matched arm | mAP50–95 | mAP50 |
|---|---|---|
| Class names only | 22.92 | 42.74 |
| Correct instructions | 19.95 | 38.61 |
| 1 visual reference | 21.62 | 40.73 |
| Instructions + 1 visual reference | 19.33 | 37.44 |
| Conservative shuffled instructions | 19.91 | 38.77 |
| Strictly shuffled instructions | 15.57 | 30.36 |
The strict shuffled arm had 12 terminal model-output failures, but correct instructions still beat it by +4.48 / +8.47 after excluding Actions, which contained 10 of those failures.
For under-specified classes, the gain from ten visual references exceeded the gain from instructions by +5.79 / +10.43. For classes requiring state or scene context, the advantage was +7.21 / +11.28. Both differences remained above zero after accounting for classes sharing a dataset. One reference showed the same direction, but that comparison was still within uncertainty.
The results support three increasingly expansive modes:
- Class names only: the cheapest, simplest default at 24.37 / 43.54.
- One boxed visual reference per class: the best accuracy-cost tradeoff for opaque, state-dependent, or visually dataset-specific tasks, at 25.35 / 46.73.
- Ten boxed visual references per class: the highest measured RF20 score at 25.74 / 47.92, and the largest observed gain when every class name in a dataset was under-specified. This is the accuracy-maximizing mode measured here, but its +0.40 / +1.20 lead over one reference is within the noise proxy and costs about 3.4× as much.
Therefore, ten references should be described as the highest observed score, not as reliably superior to one reference. Label sufficiency is a useful dataset-level routing signal, not a guarantee. Instructions remain useful as a separate research result, but they are not one of the recommended deployment modes. The clean prospective confirmation is a matched correct-reference versus class-shuffled-reference control using the already locked sufficiency ratings.
All 20 per-dataset deltas versus class names only
Each cell is mAP50–95 / mAP50.
| Dataset | Instructions | 1 visual | 10 visual |
|---|---|---|---|
| Actions | +0.83 / +0.96 | +2.11 / +3.55 | +2.02 / +4.57 |
| Aerial Airport | −3.95 / −7.69 | −0.14 / −2.01 | +3.41 / +2.06 |
| All Elements | −6.47 / −0.47 | −7.59 / −0.65 | −12.39 / −12.77 |
| Aquarium Combined | −2.93 / −2.02 | −3.14 / −0.42 | −3.32 / −0.34 |
| Defect Detection | +8.60 / +13.22 | +4.16 / +6.35 | +11.25 / +18.85 |
| DentalAI | −0.65 / −1.95 | +0.45 / +1.04 | +0.28 / +0.85 |
| FLIR Camera Objects | −1.84 / −4.71 | +0.12 / −1.68 | −3.85 / −7.24 |
| Global Wheat Head | −3.56 / −4.33 | −2.69 / −3.64 | −3.12 / −4.54 |
| Lacrosse Object Detection | +1.46 / +2.93 | +0.55 / +4.18 | −0.49 / +5.75 |
| New Defects in Wood | +1.90 / +7.35 | +1.63 / +3.84 | +1.22 / +4.54 |
| Orion Products | +0.51 / +7.88 | +3.97 / +18.25 | +1.84 / +15.11 |
| Paper Parts | −0.50 / −0.04 | +13.60 / +19.25 | +9.73 / +16.13 |
| Recode Waste | +4.09 / +7.49 | +1.22 / +3.07 | +3.96 / +6.68 |
| Soda Bottles | +0.12 / −0.35 | +0.84 / +0.70 | +2.01 / +3.37 |
| The Dreidel Project | +15.50 / +19.89 | +9.66 / +17.39 | +10.71 / +22.26 |
| Trail Camera | +0.94 / −1.00 | −1.67 / −0.27 | −0.43 / +0.91 |
| Water Meter | −15.00 / −26.63 | −16.55 / −29.58 | −20.57 / −41.40 |
| WB Prova | +1.68 / +0.62 | +12.32 / +16.12 | +17.51 / +24.32 |
| Wildfire Smoke | +0.88 / +8.90 | +0.11 / +4.69 | +5.06 / +18.90 |
| X-ray ID | +0.10 / +0.74 | +0.61 / +3.53 | +2.62 / +9.62 |
- Quantitative source:
qwen38-fsod-runs/instruction-study-v2/analysis/rf20_per_dataset.csv - Class-level source:
qwen38-fsod-runs/instruction-study-v2/analysis/rf20_per_class.csv - Noise study:
QWEN38_LARGE_DATASET_NOISE_RESULT.md - Locked class-name ratings:
qwen38-fsod-configs/rf20-label-sufficiency-ratings.json - Figure generator:
analysis/generate_qwen38_context_adaptation_figures.py - Exact illustrated image/reference IDs:
figures/qwen38_context_adaptation/selection_manifest.json
Regenerate the visual evidence with Pillow installed:
python analysis/generate_qwen38_context_adaptation_figures.pyThe qualitative cards intentionally choose the largest per-image F1@0.5 improvement or regression within each fixed dataset/class pair so the mechanism is visible. They are illustrations, not the statistical evidence; all reported claims come from the complete COCO evaluations above.