Repository navigation
关于项目可观测方案及效果说明 #2371
happy-v587
started this conversation in
Show and tell
关于项目可观测方案及效果说明
#2371

Replies: 2 comments 6 replies

第一步:powercontext observability up 效果展示给 powercontext cli 实现 observability 子命令 
启动服务服务启动 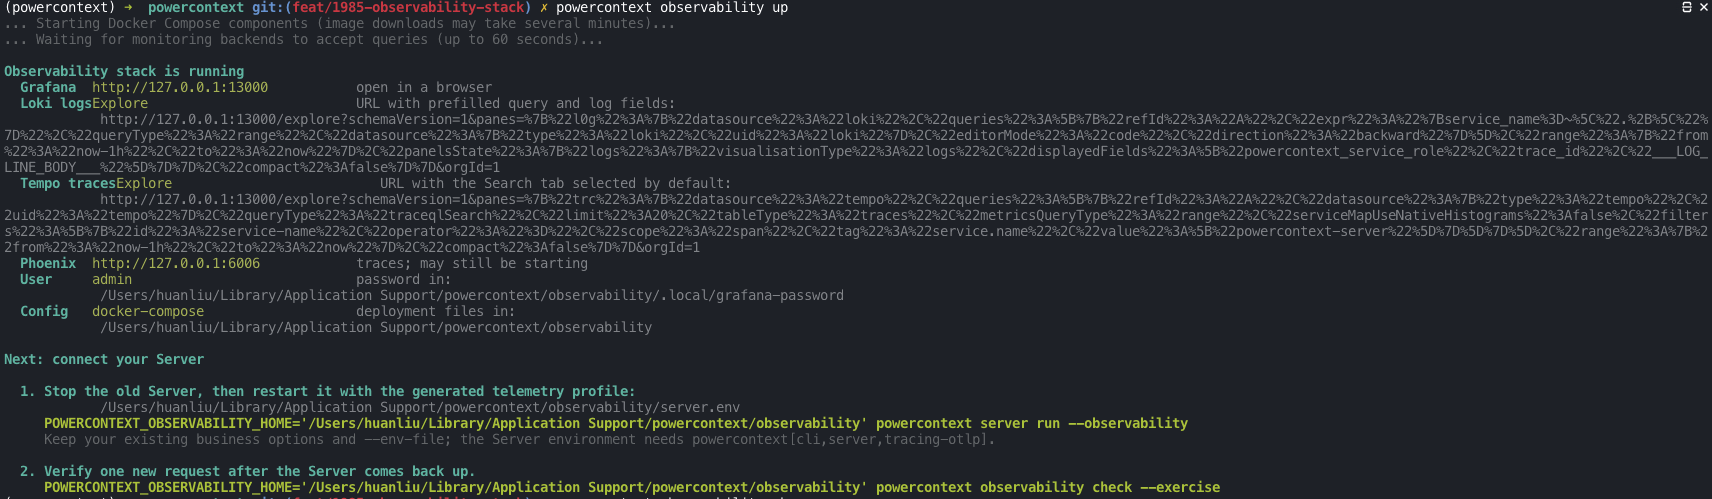
服务状态查看 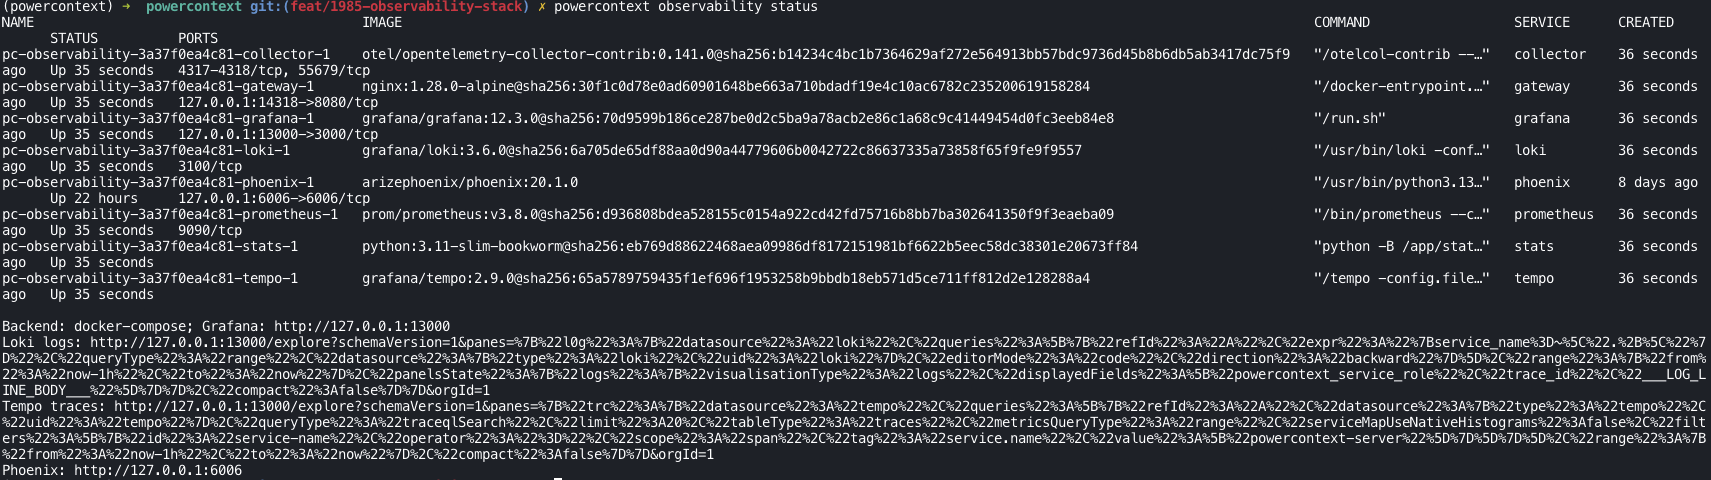
服务健康性检查 
效果预览trace
Phoenix页面 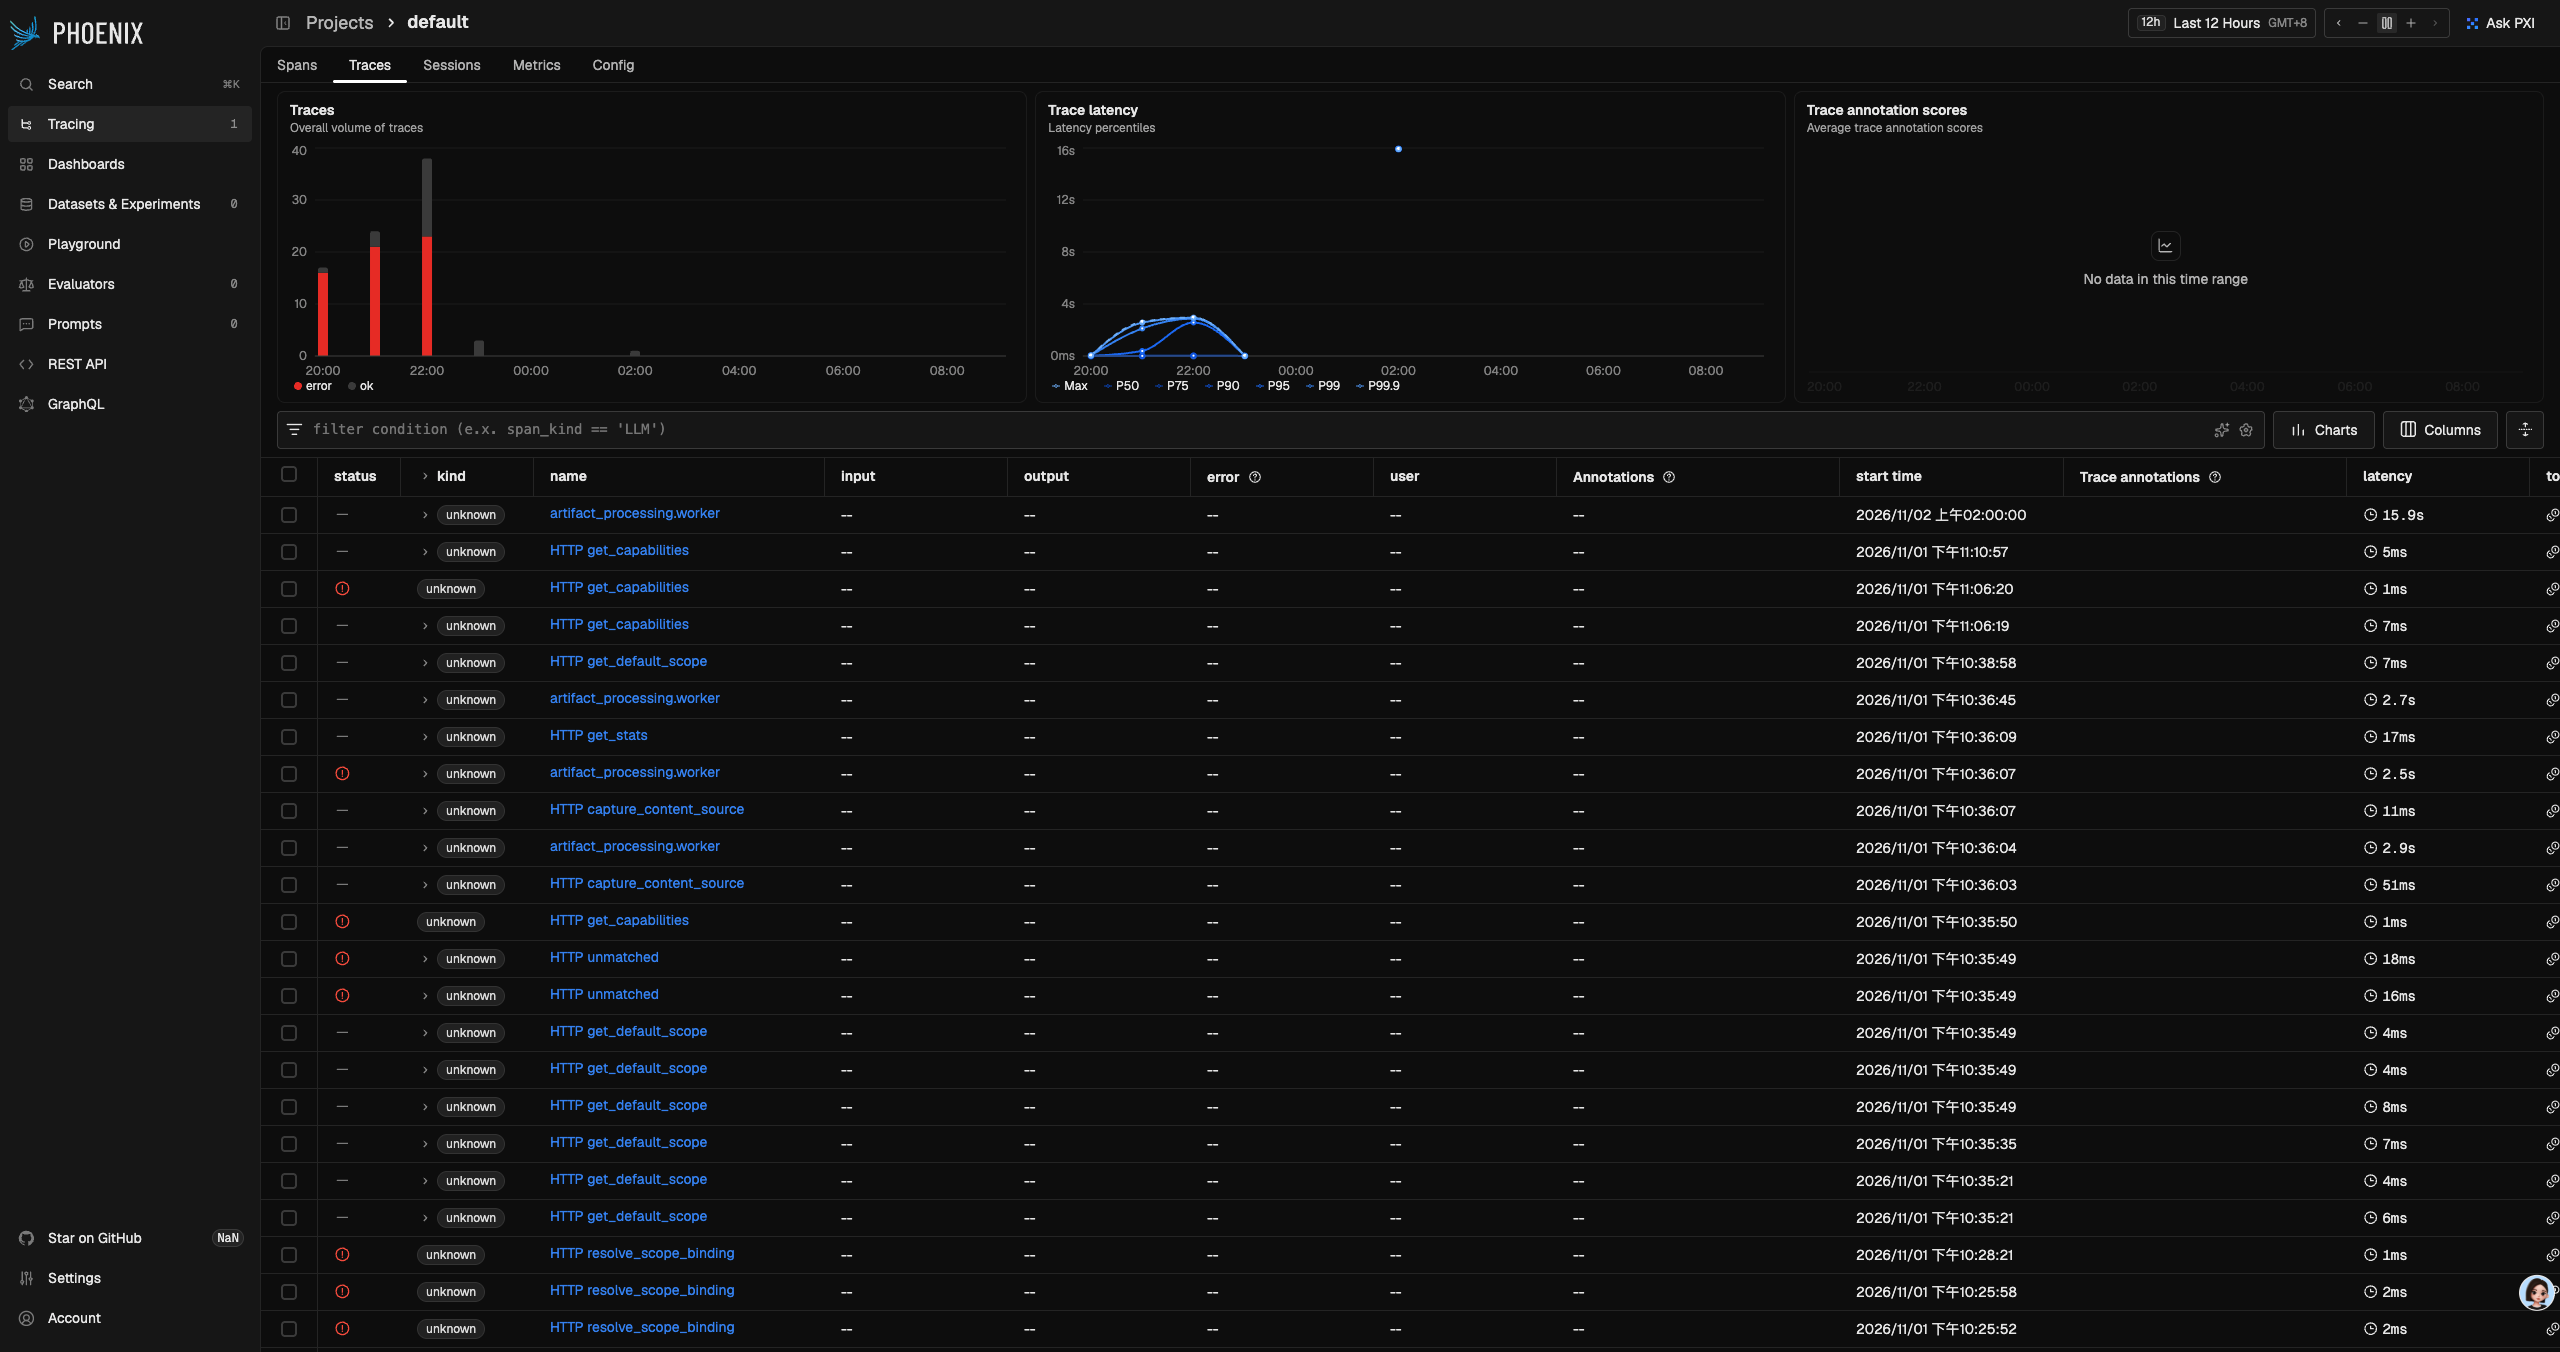
tempo 页面 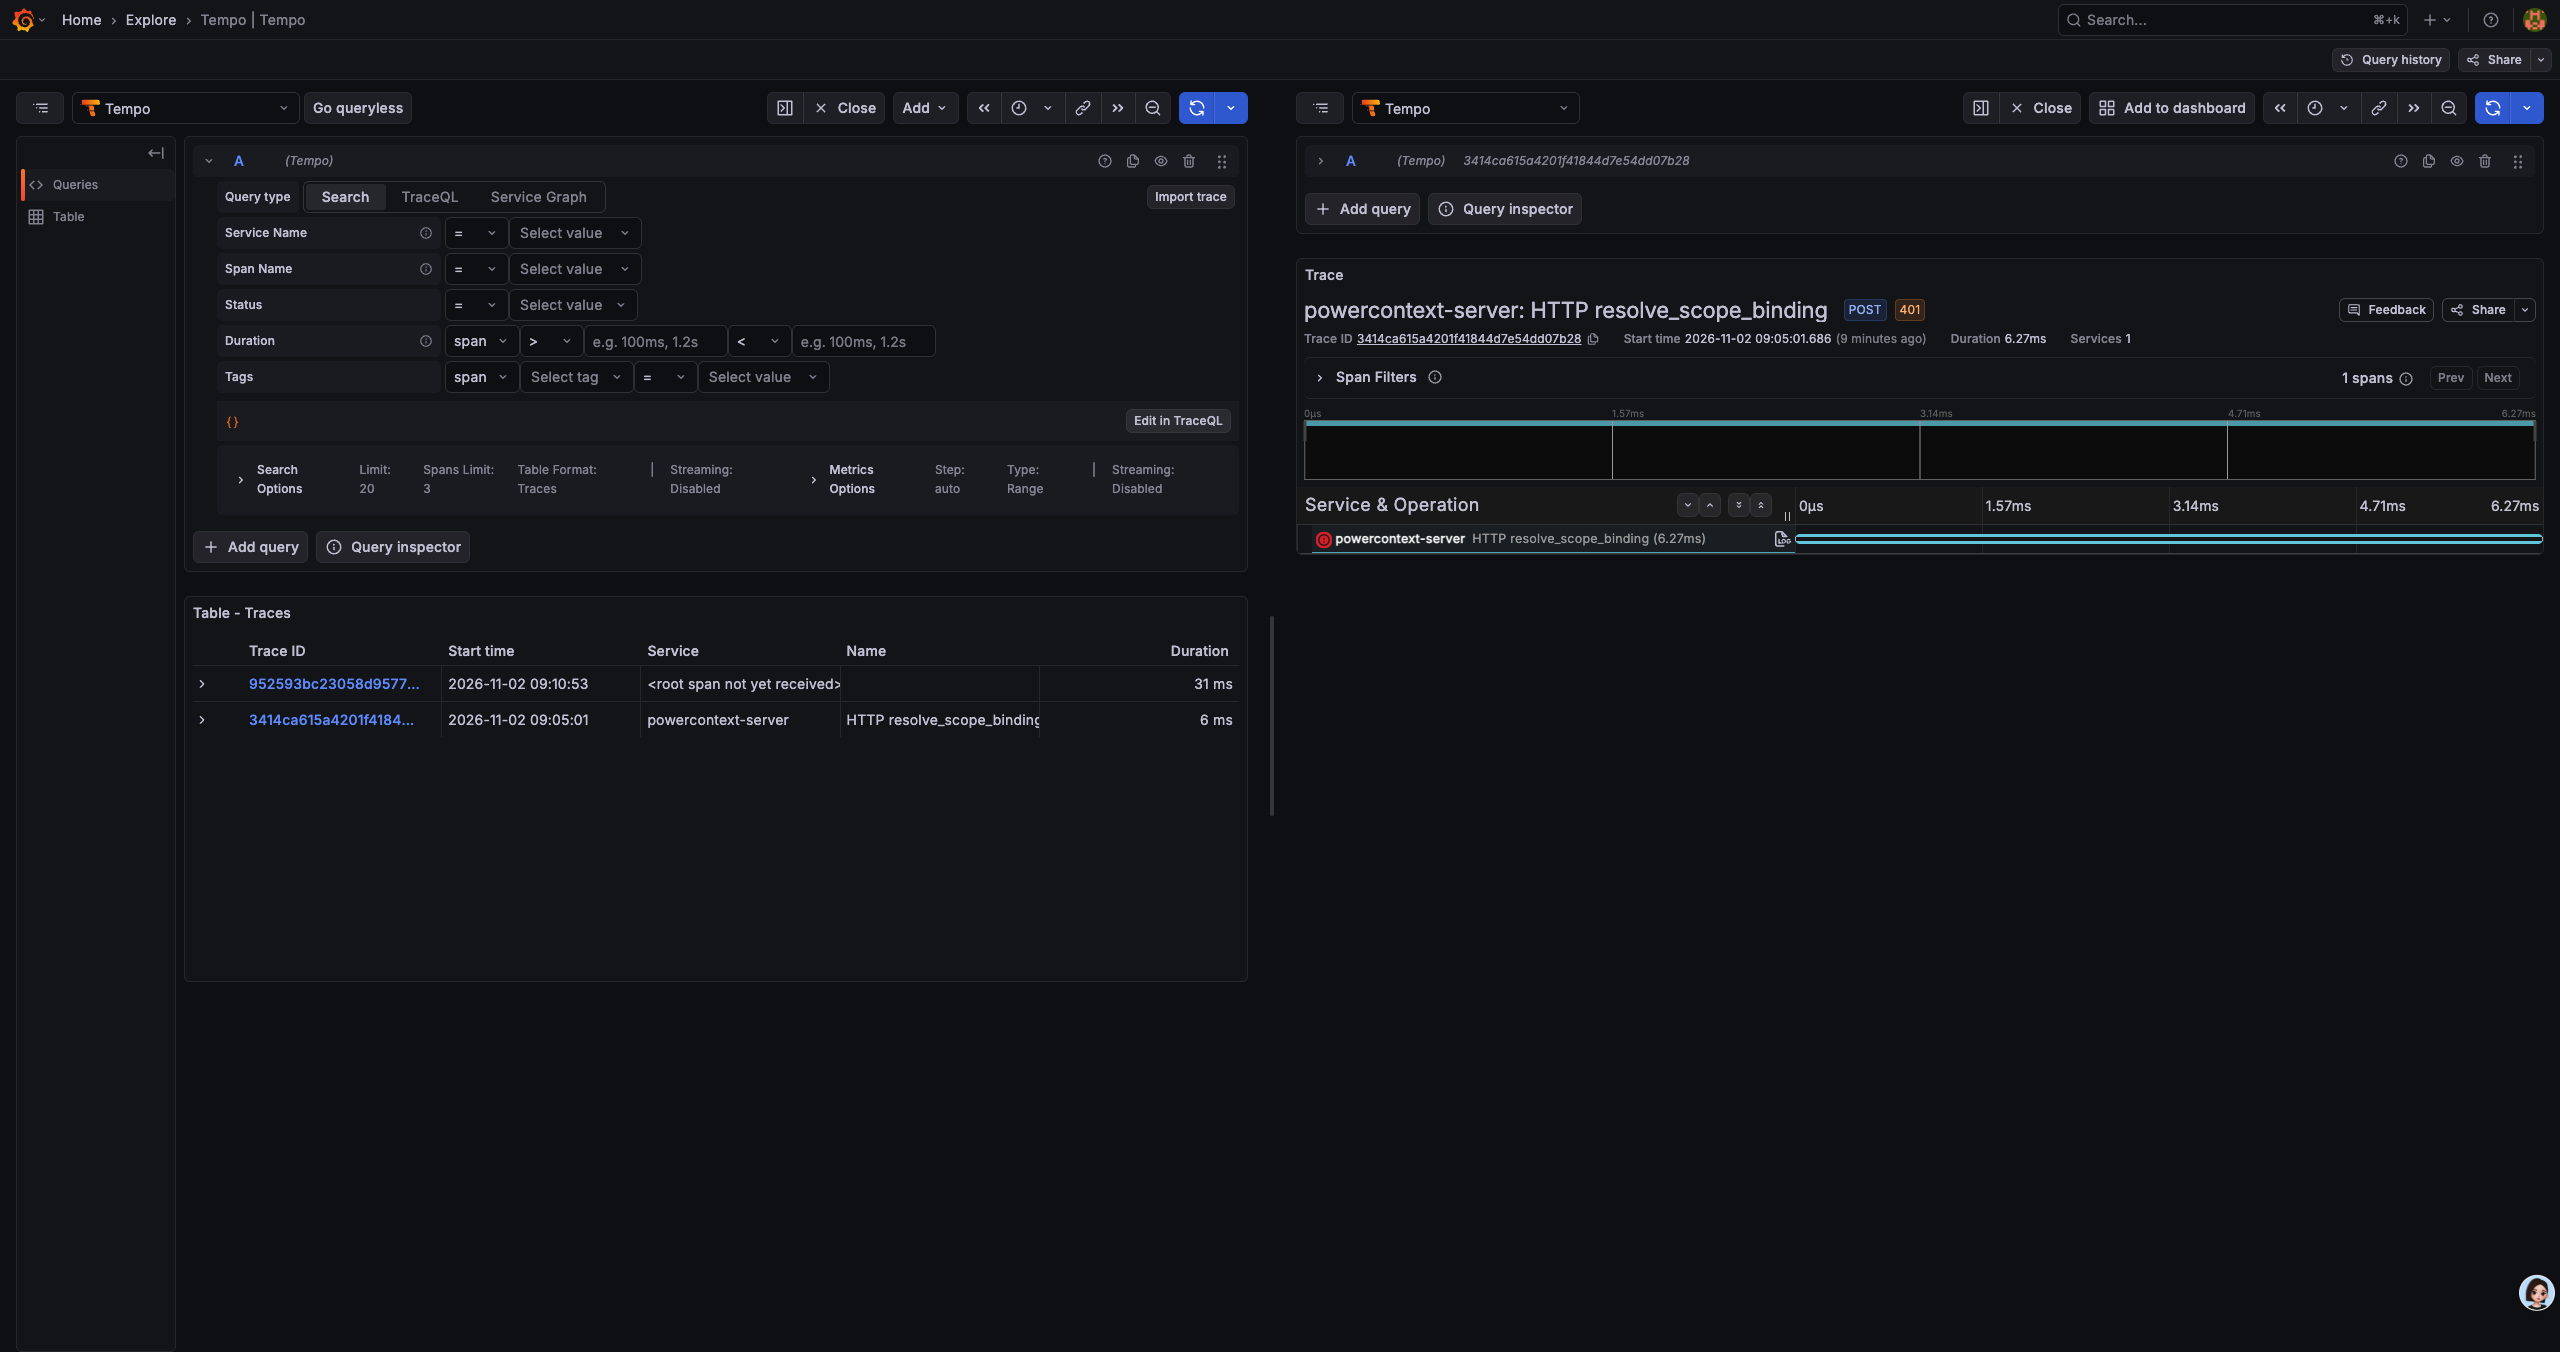
log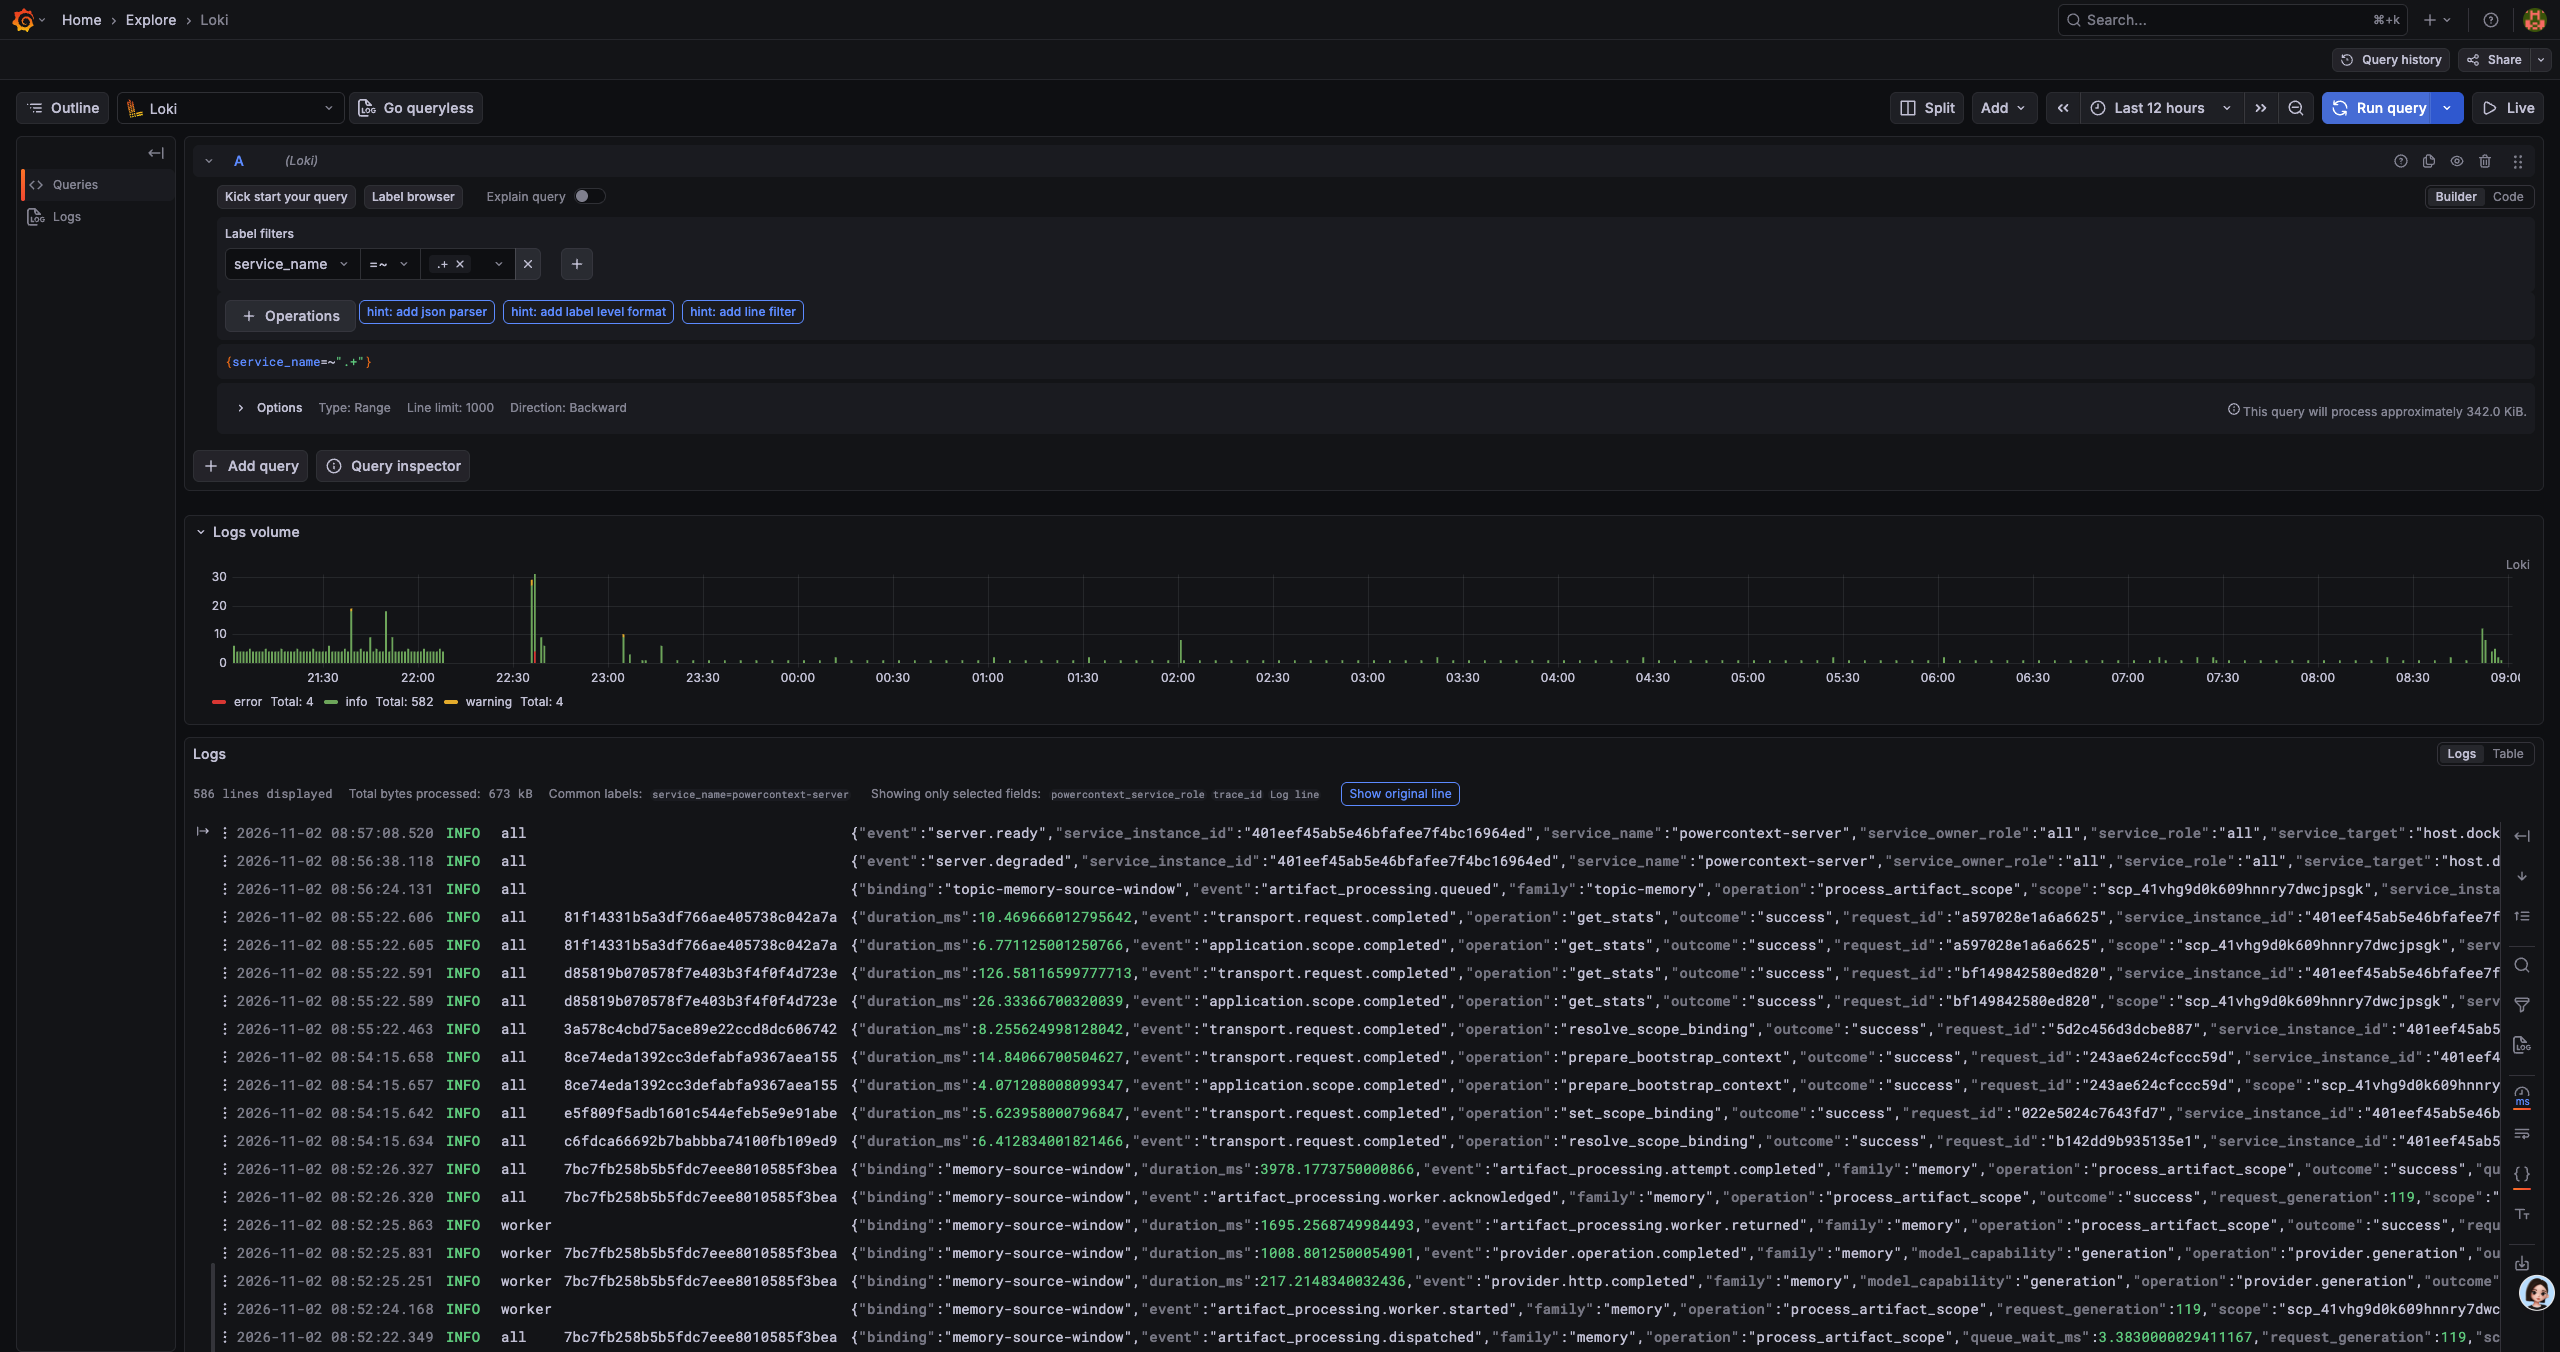
metric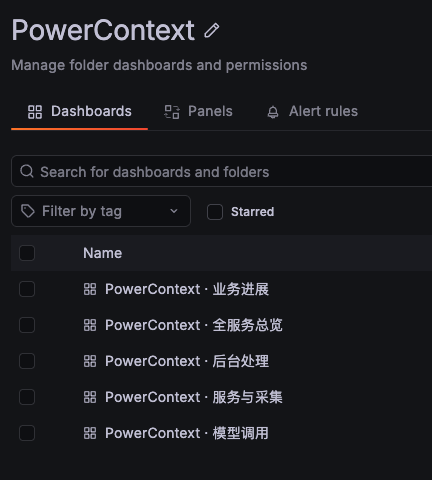
服务总览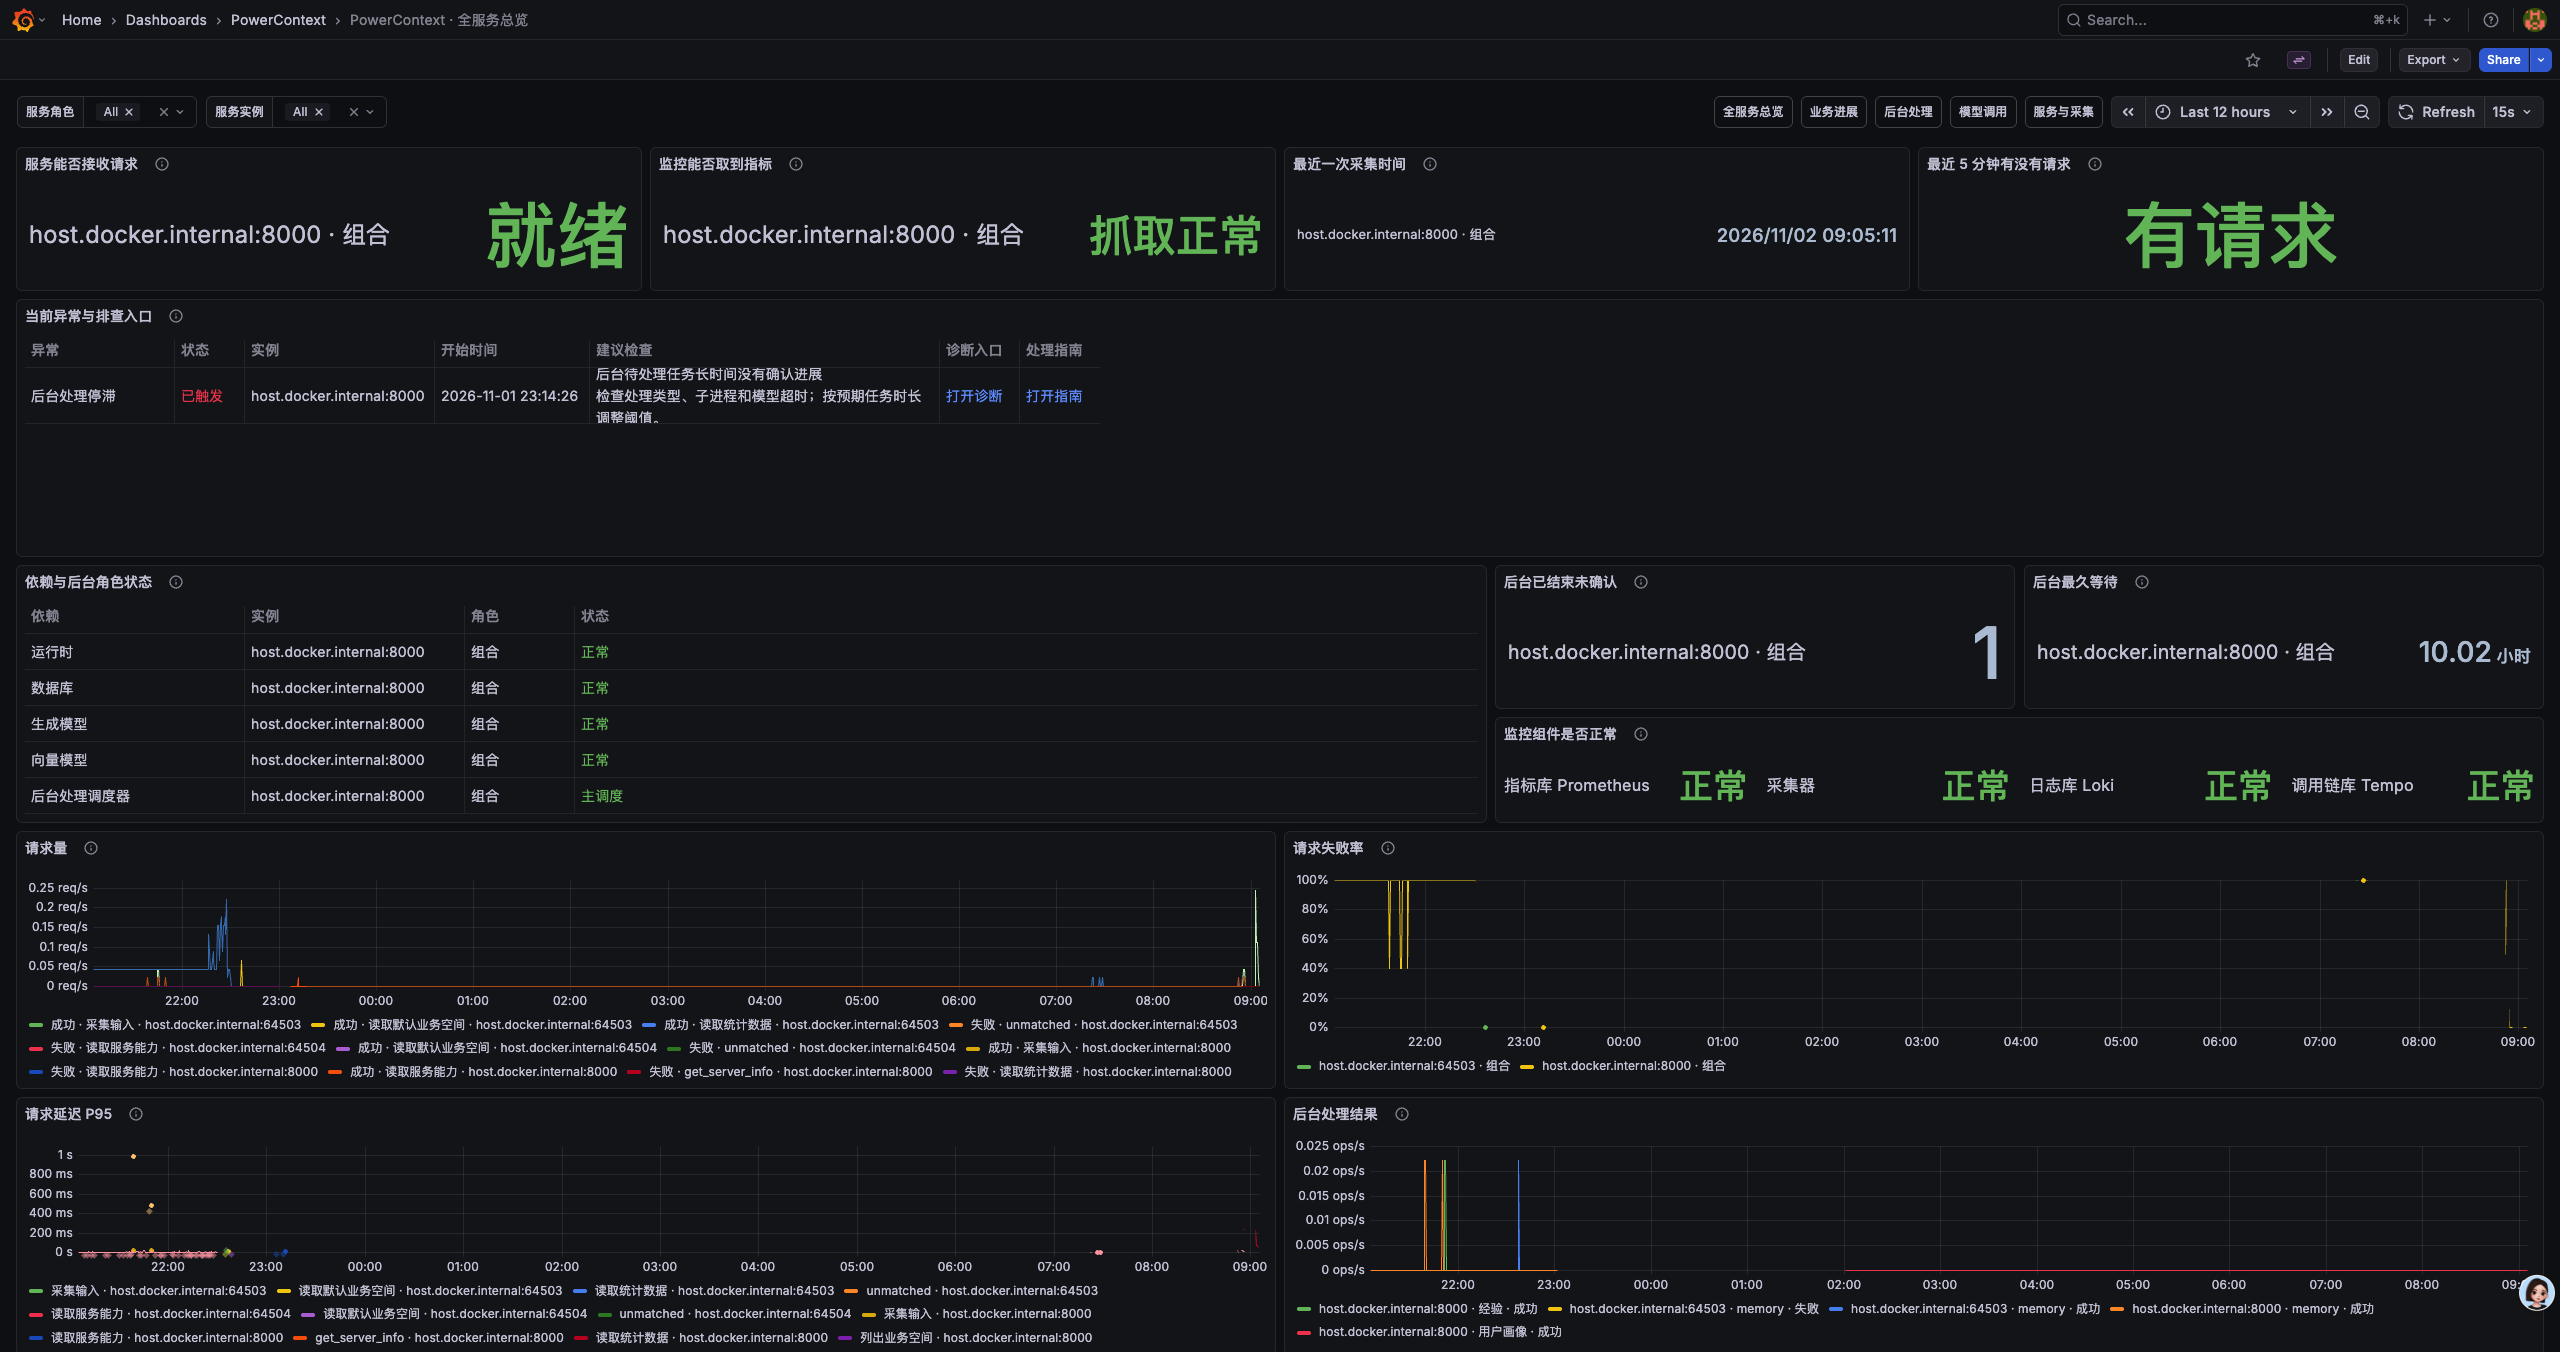
业务进展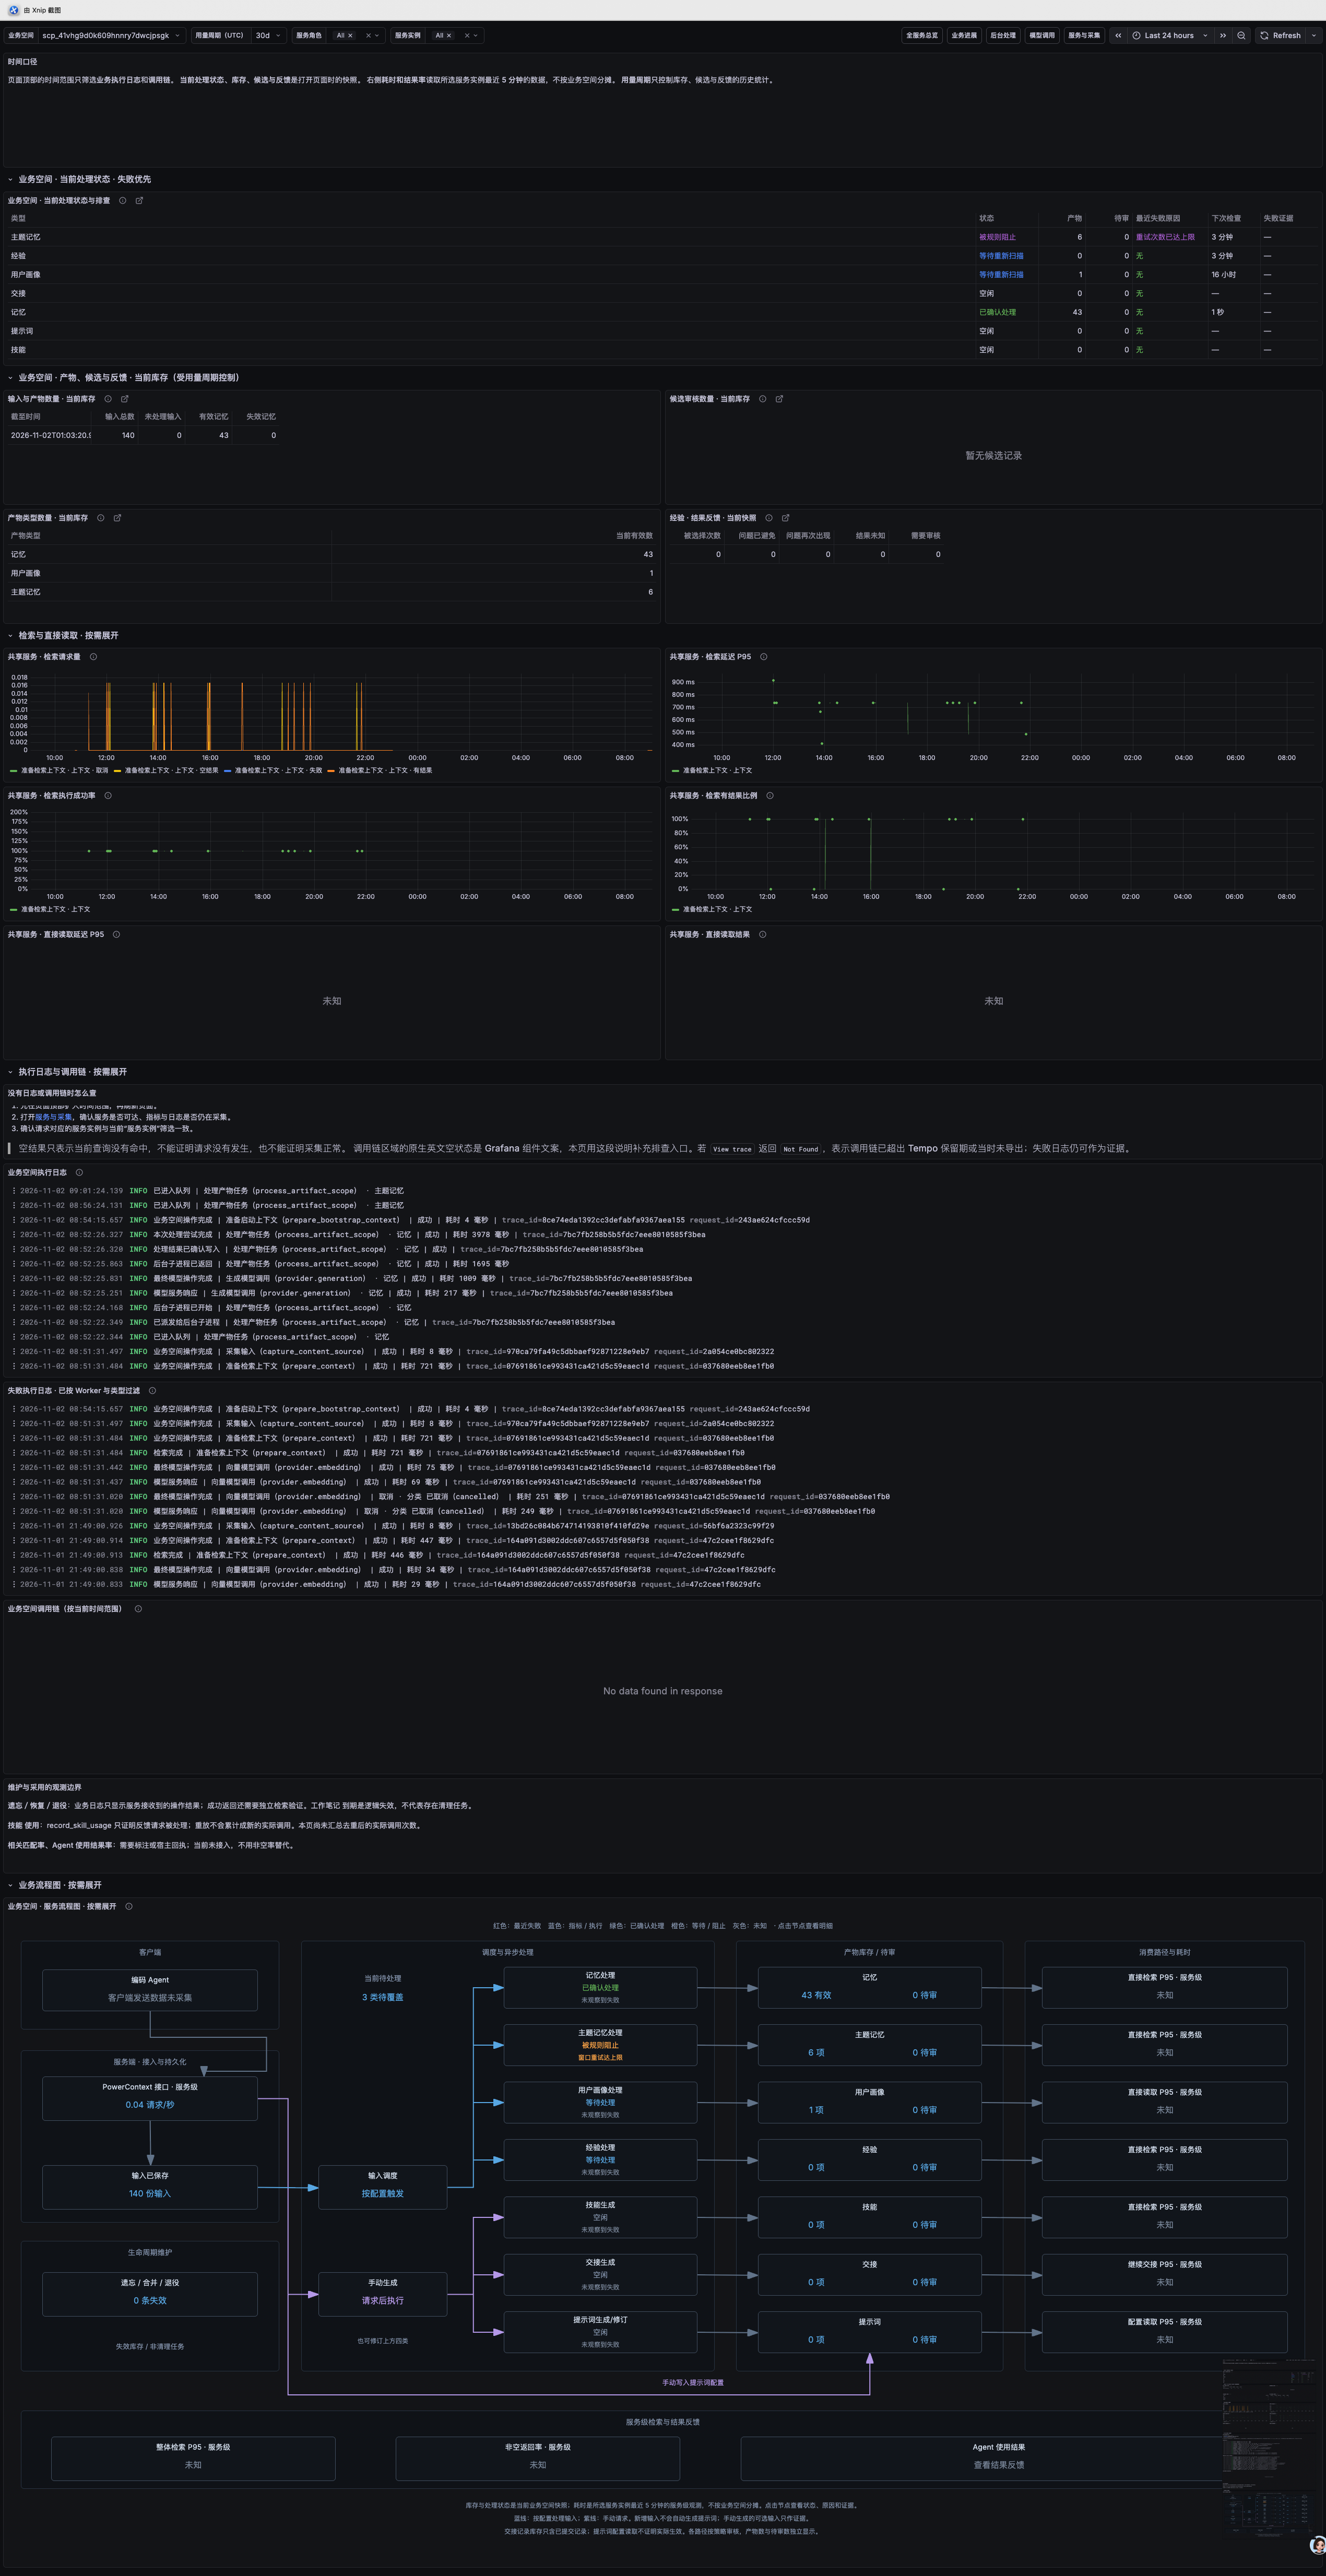
后台处理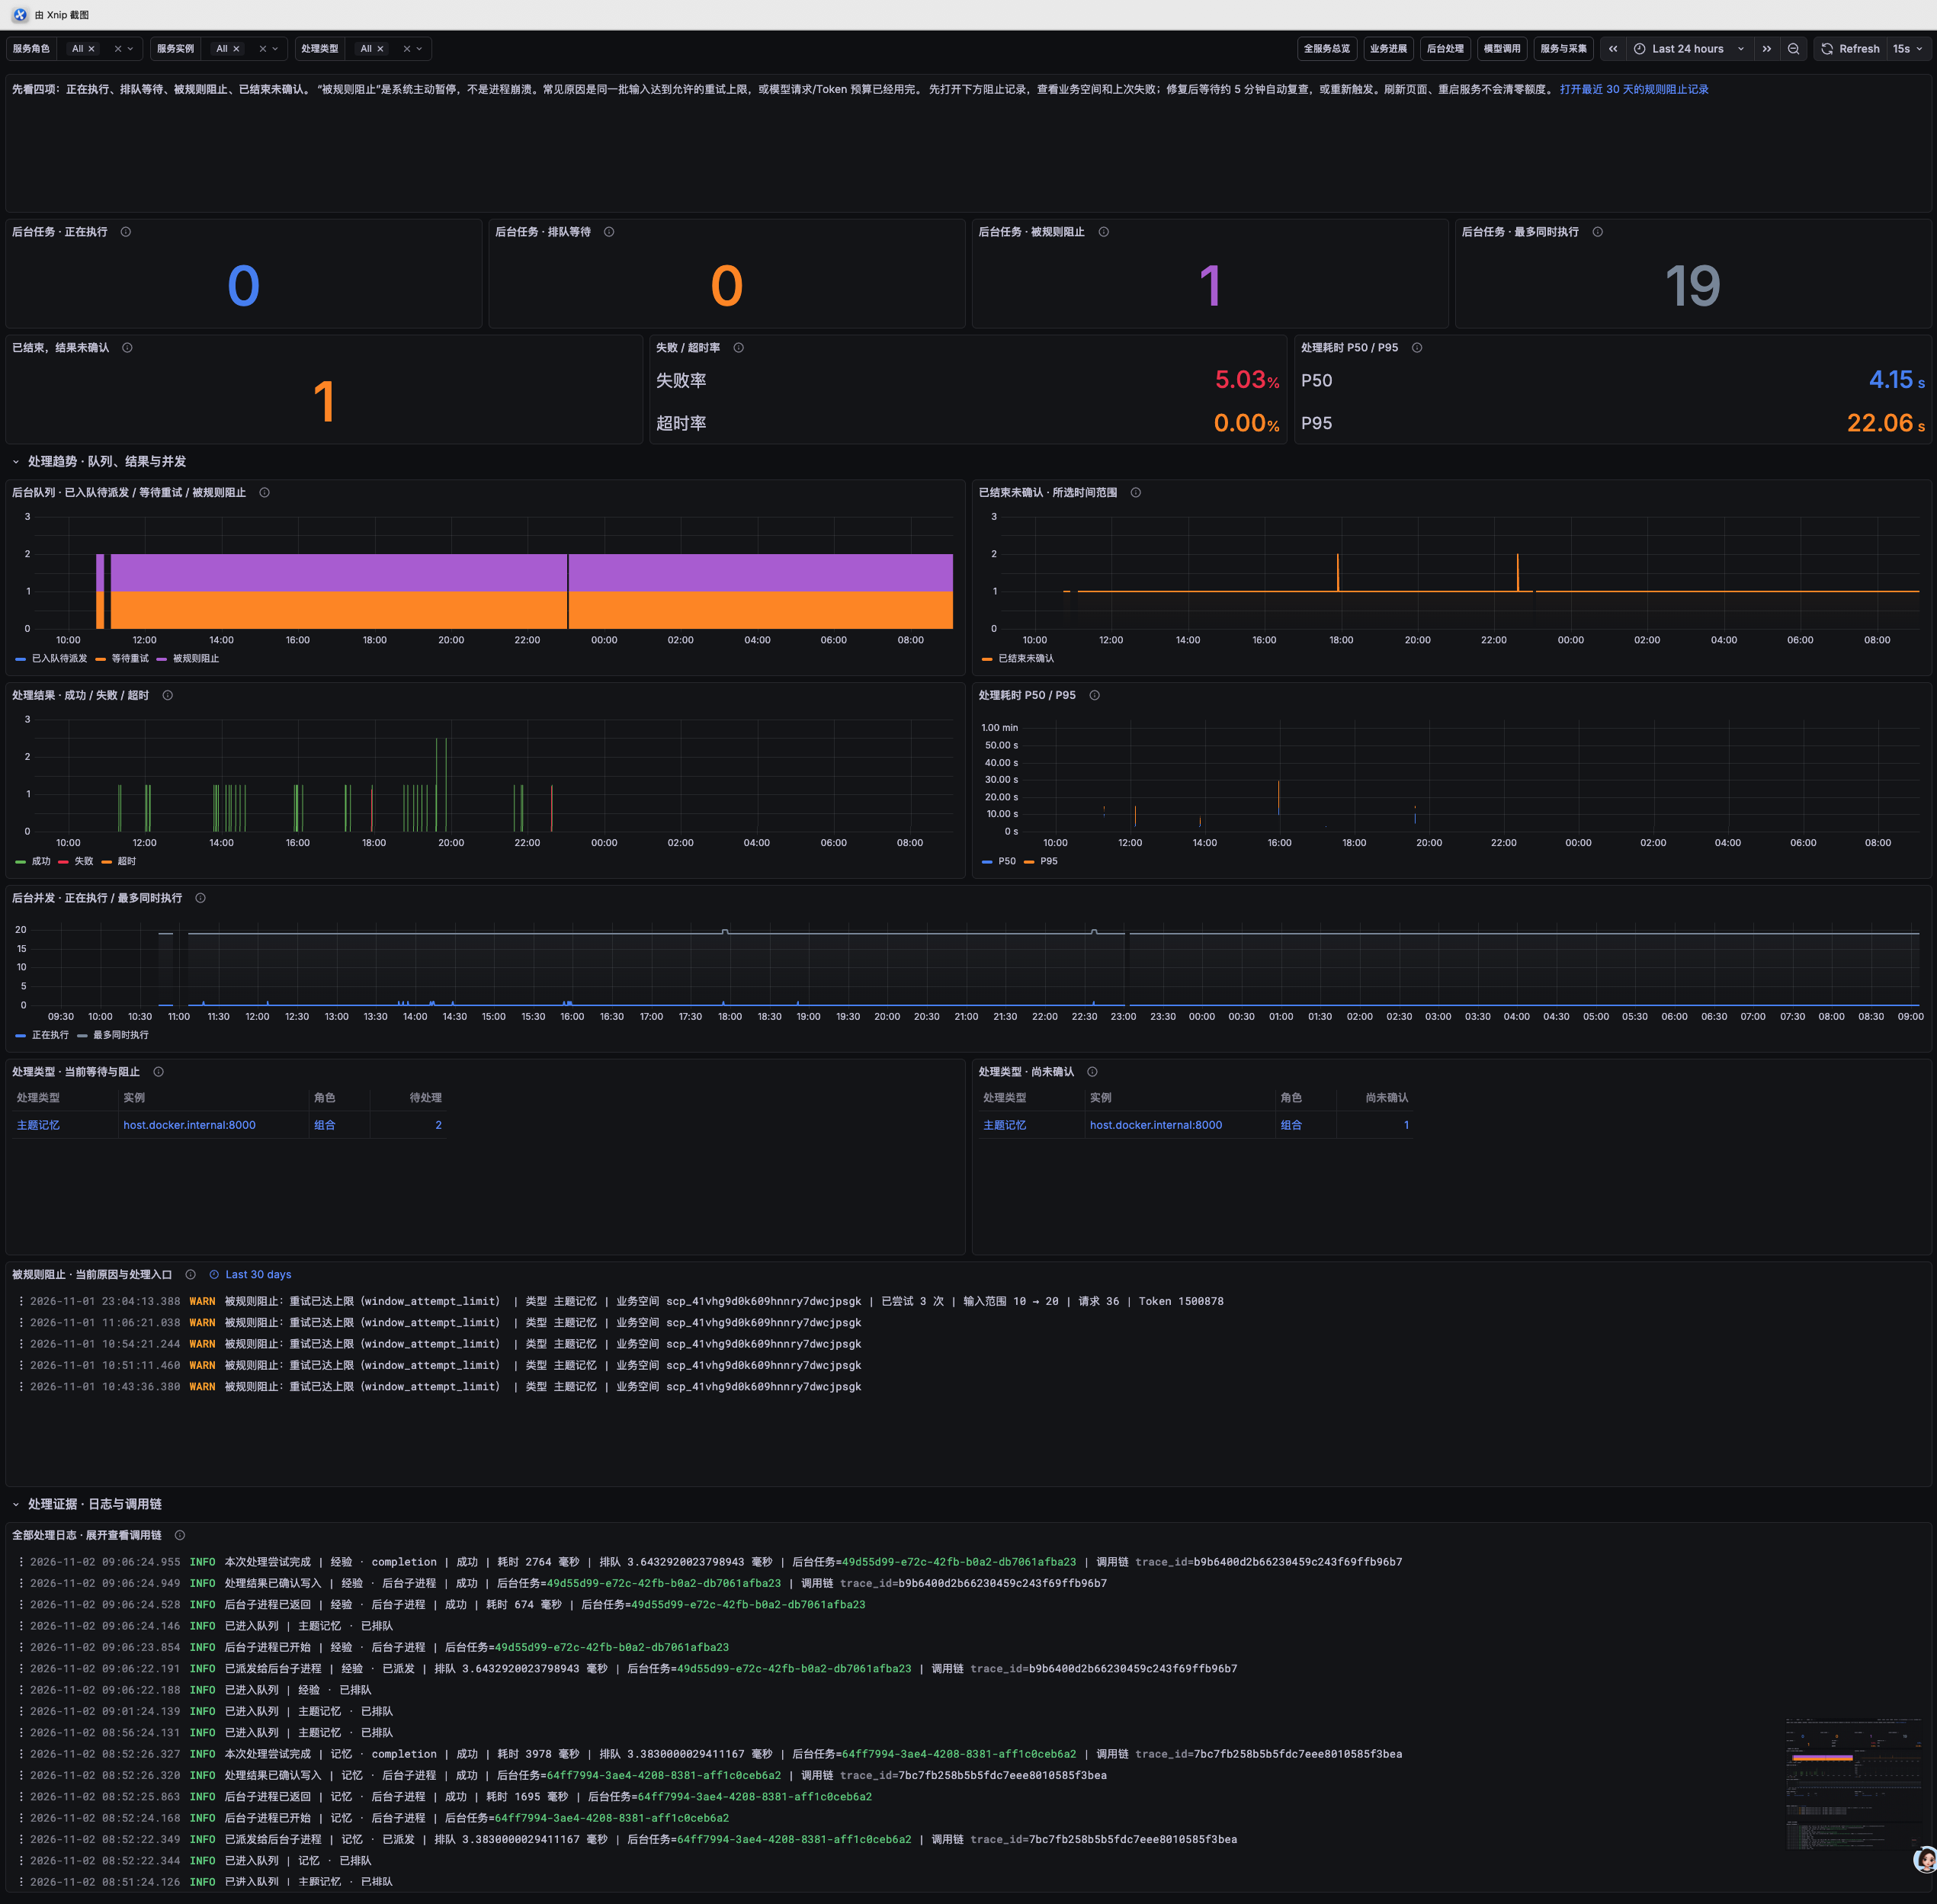
服务与采集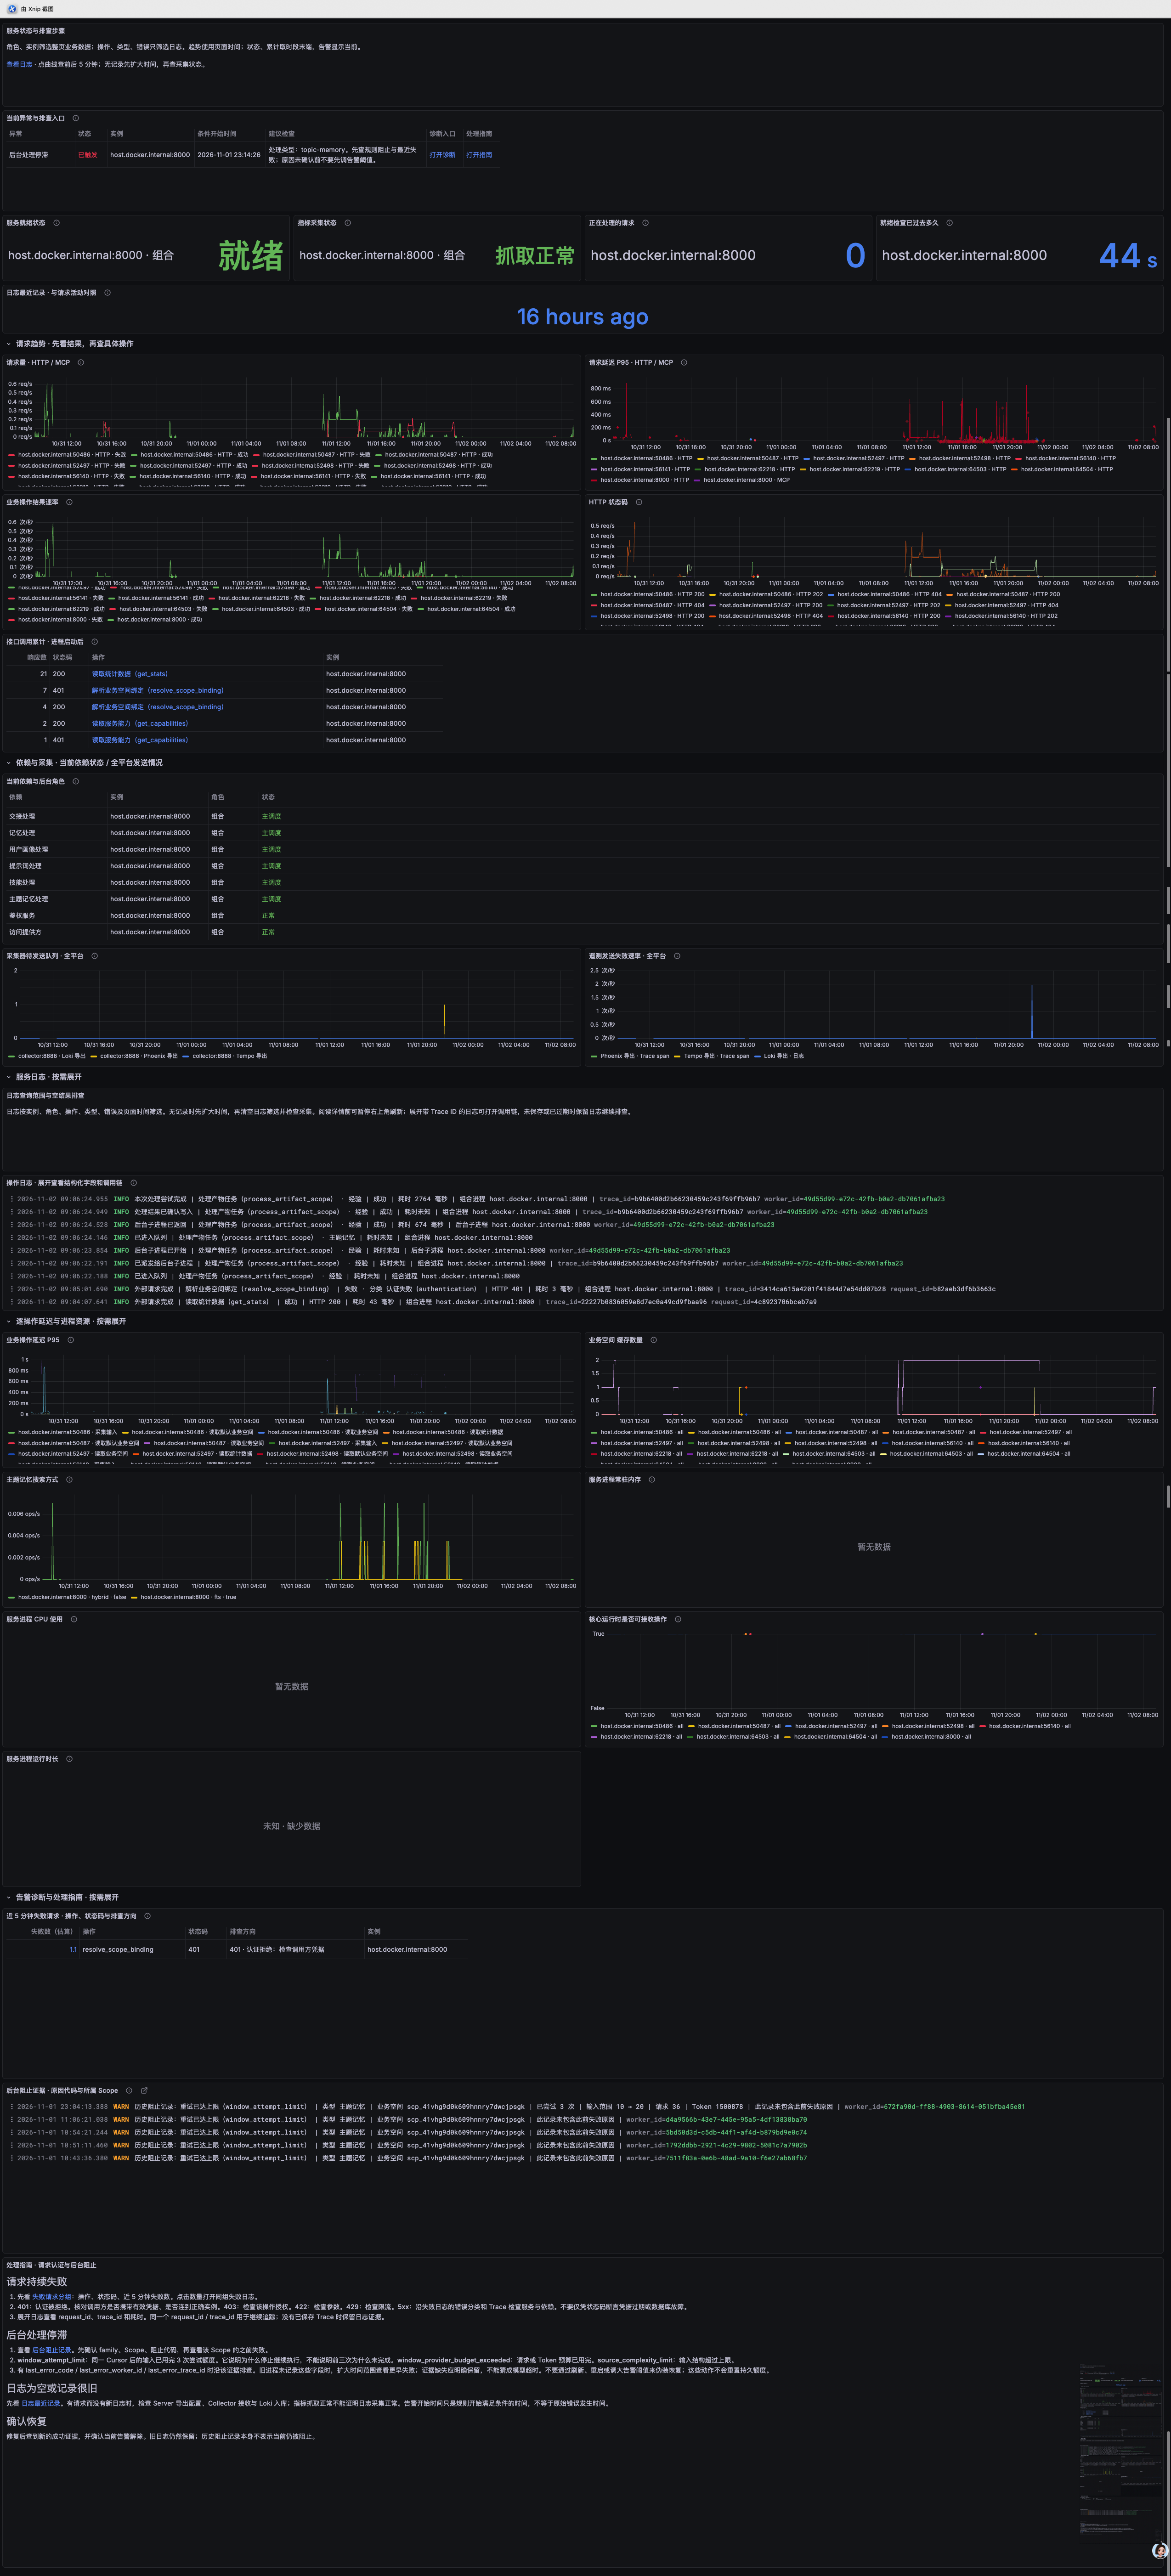
模型调用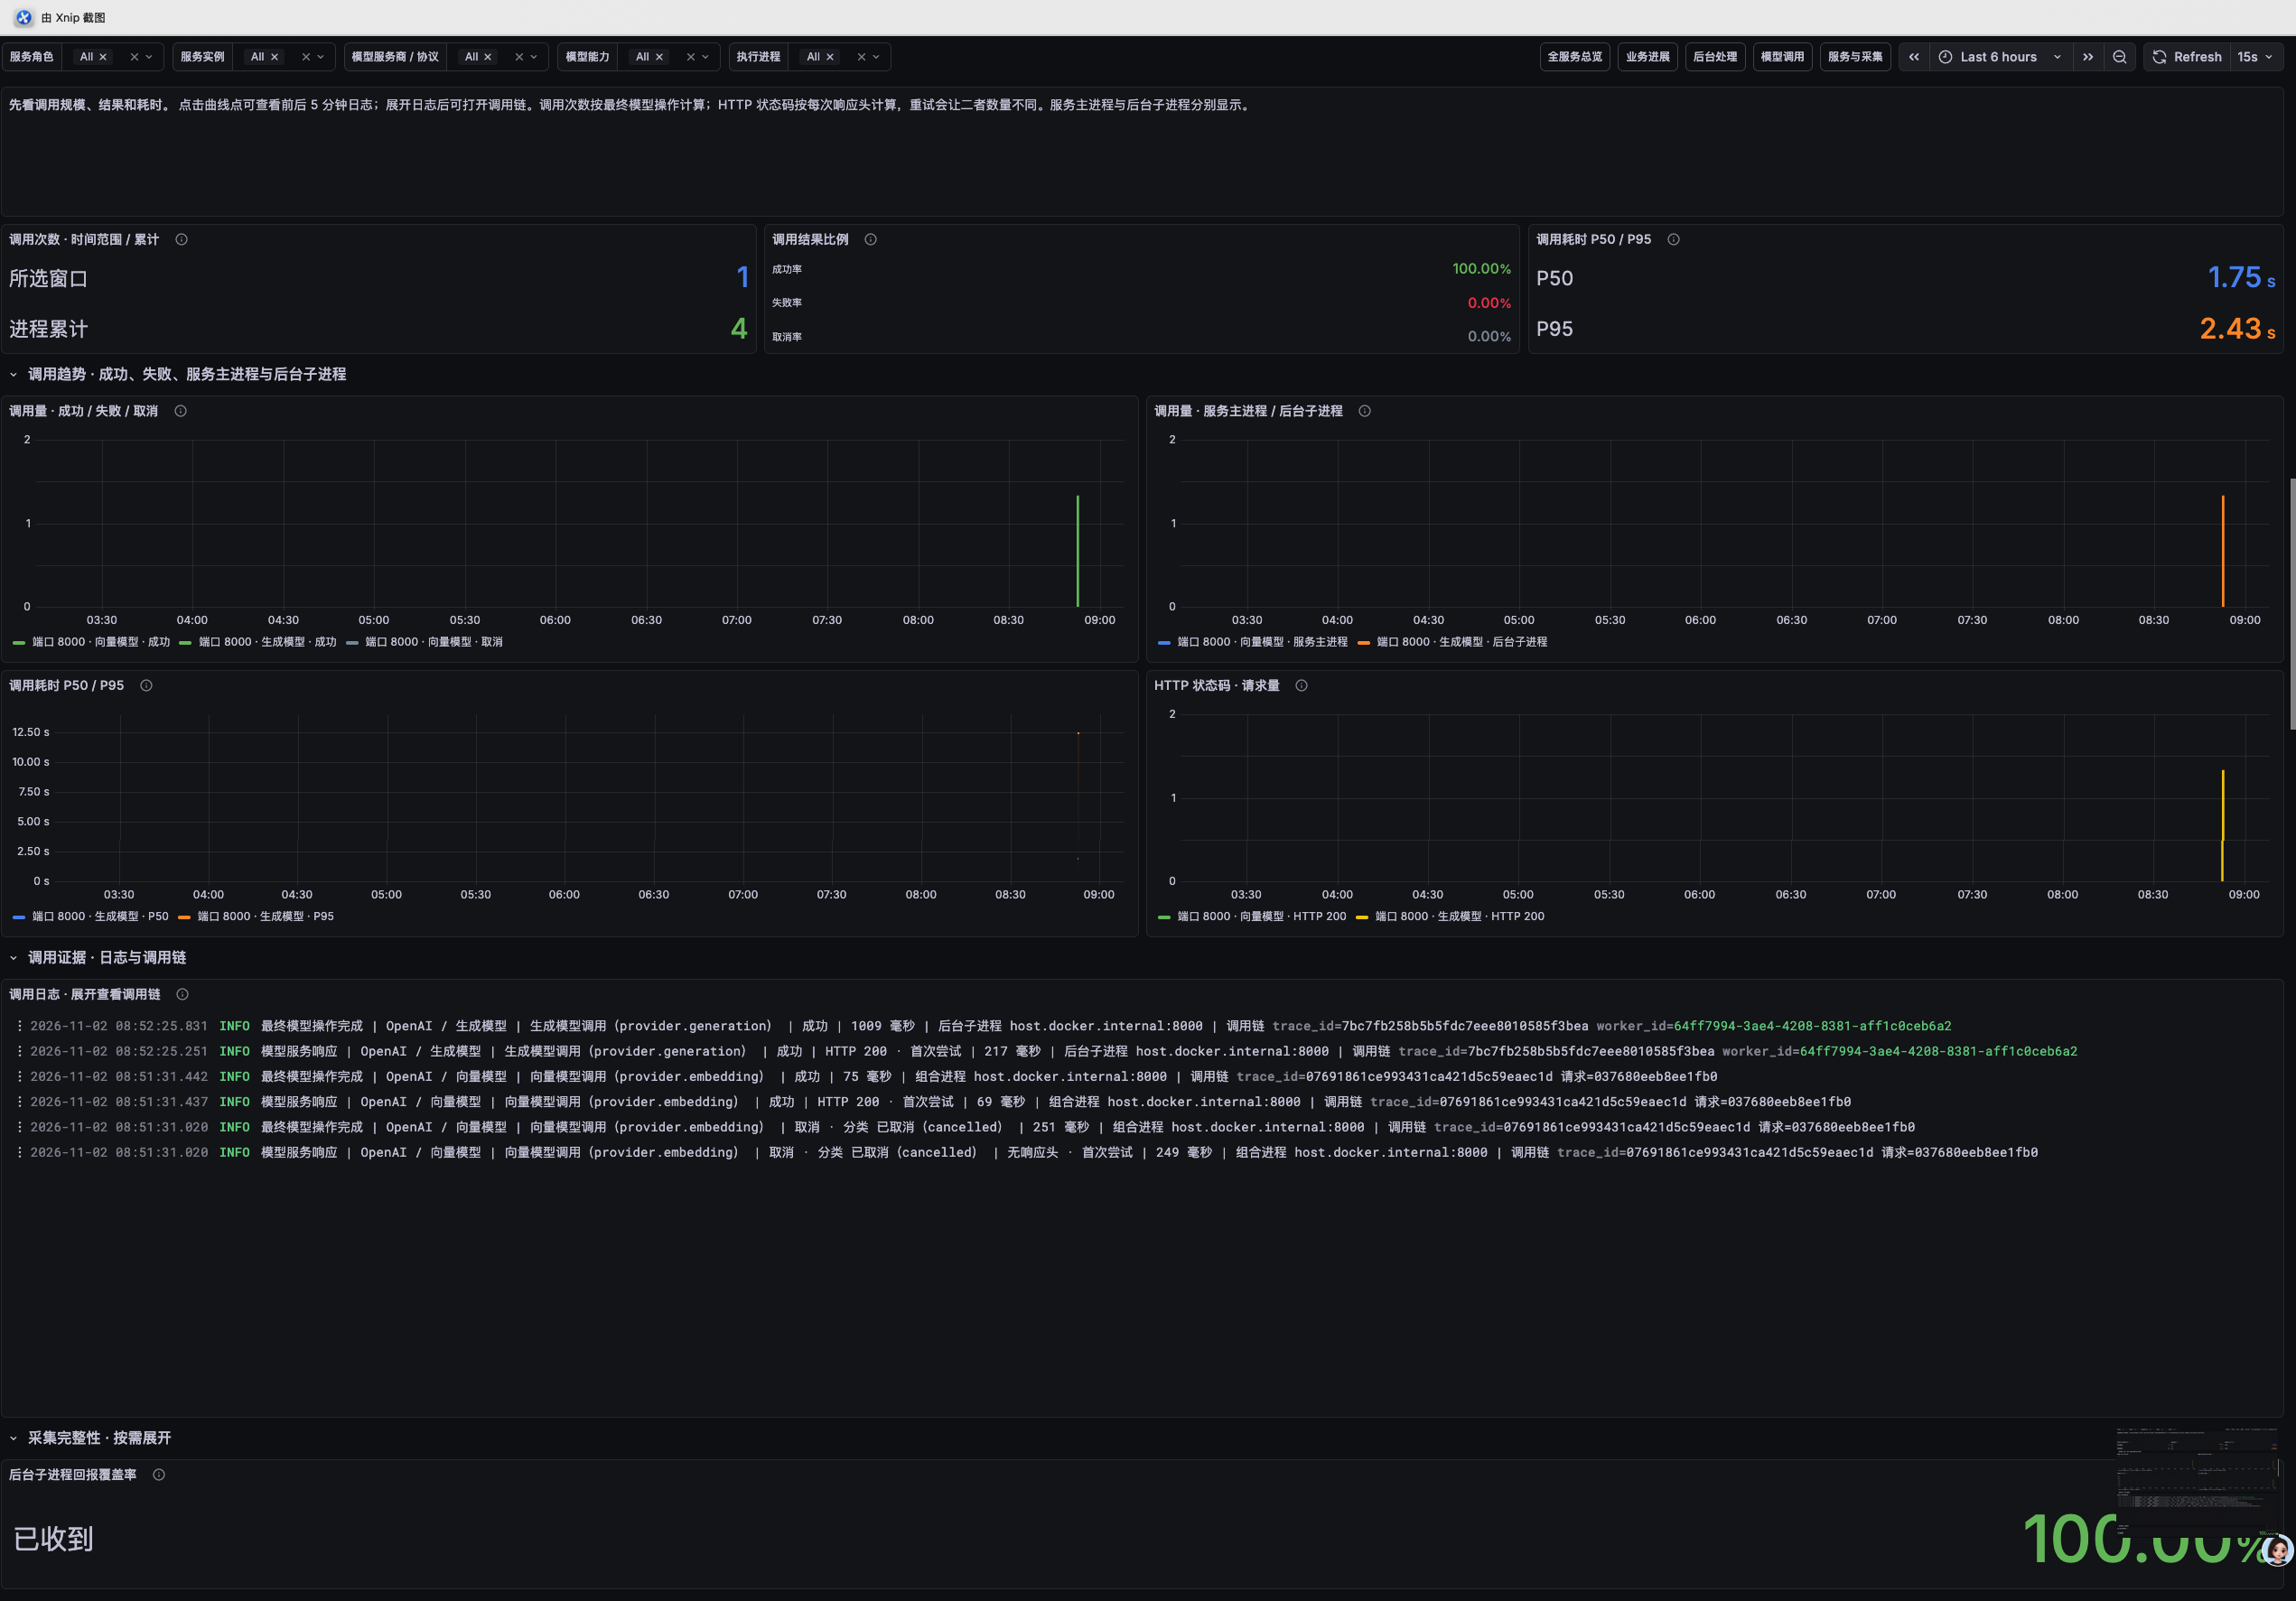
|
0 replies
第二步:在现有dashboard添加数据统计页面 |
6 replies

首页1、当系统有异常的时候,可以在首页直接看到对应的报错,跳转详情可以看到具体信息。(如果想要丝滑排查问题,还需要继续优化。这块数据依赖接口返回) 2、添加了一些业务数据,可以清晰的看到保存了多少数据,沉淀出来多少技能、经验、记忆等,上下文召回多少次 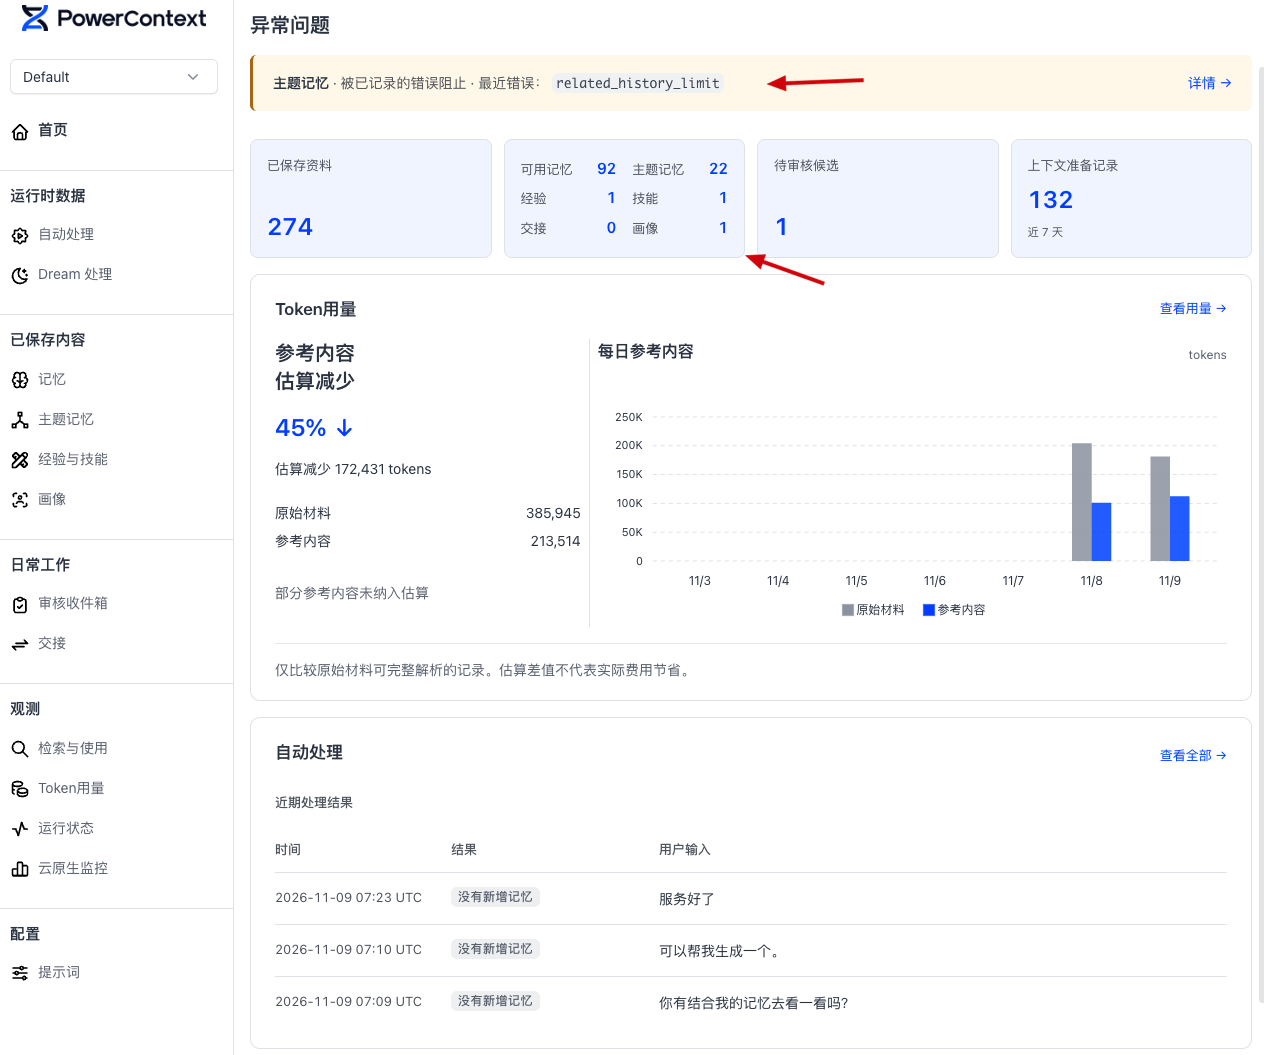
|
运行时数据自动处理当前服务处理source的流程展示出来。让用户使用起来更透明。 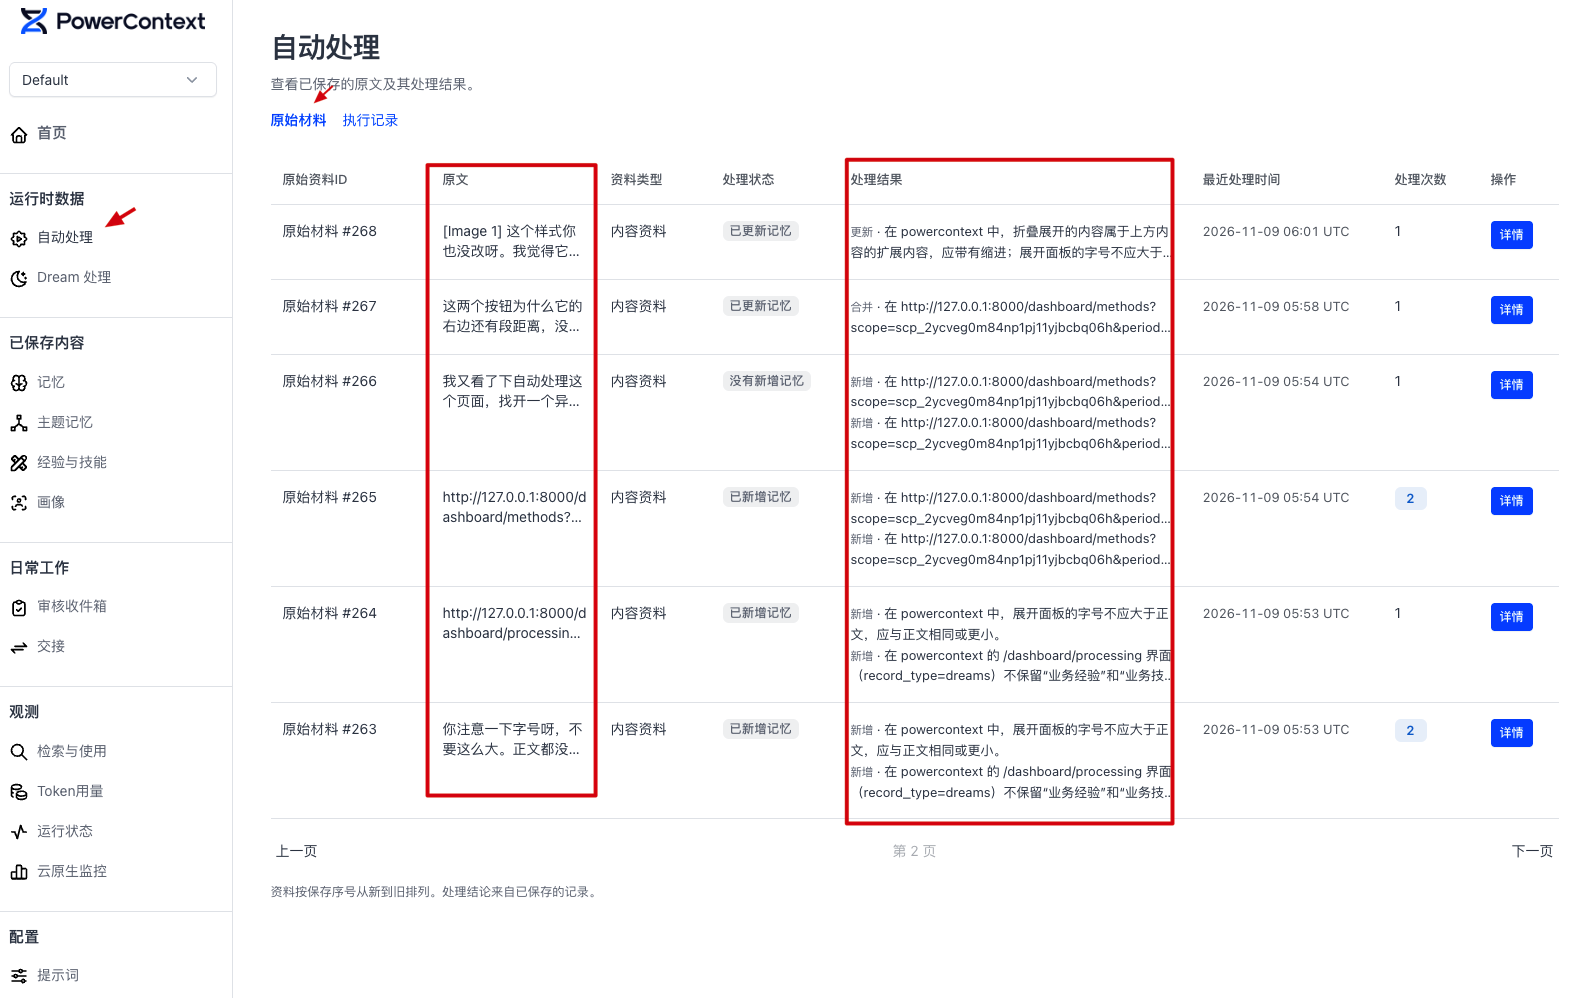
每一个原始数据都会有三个步骤,输入、处理和输出。 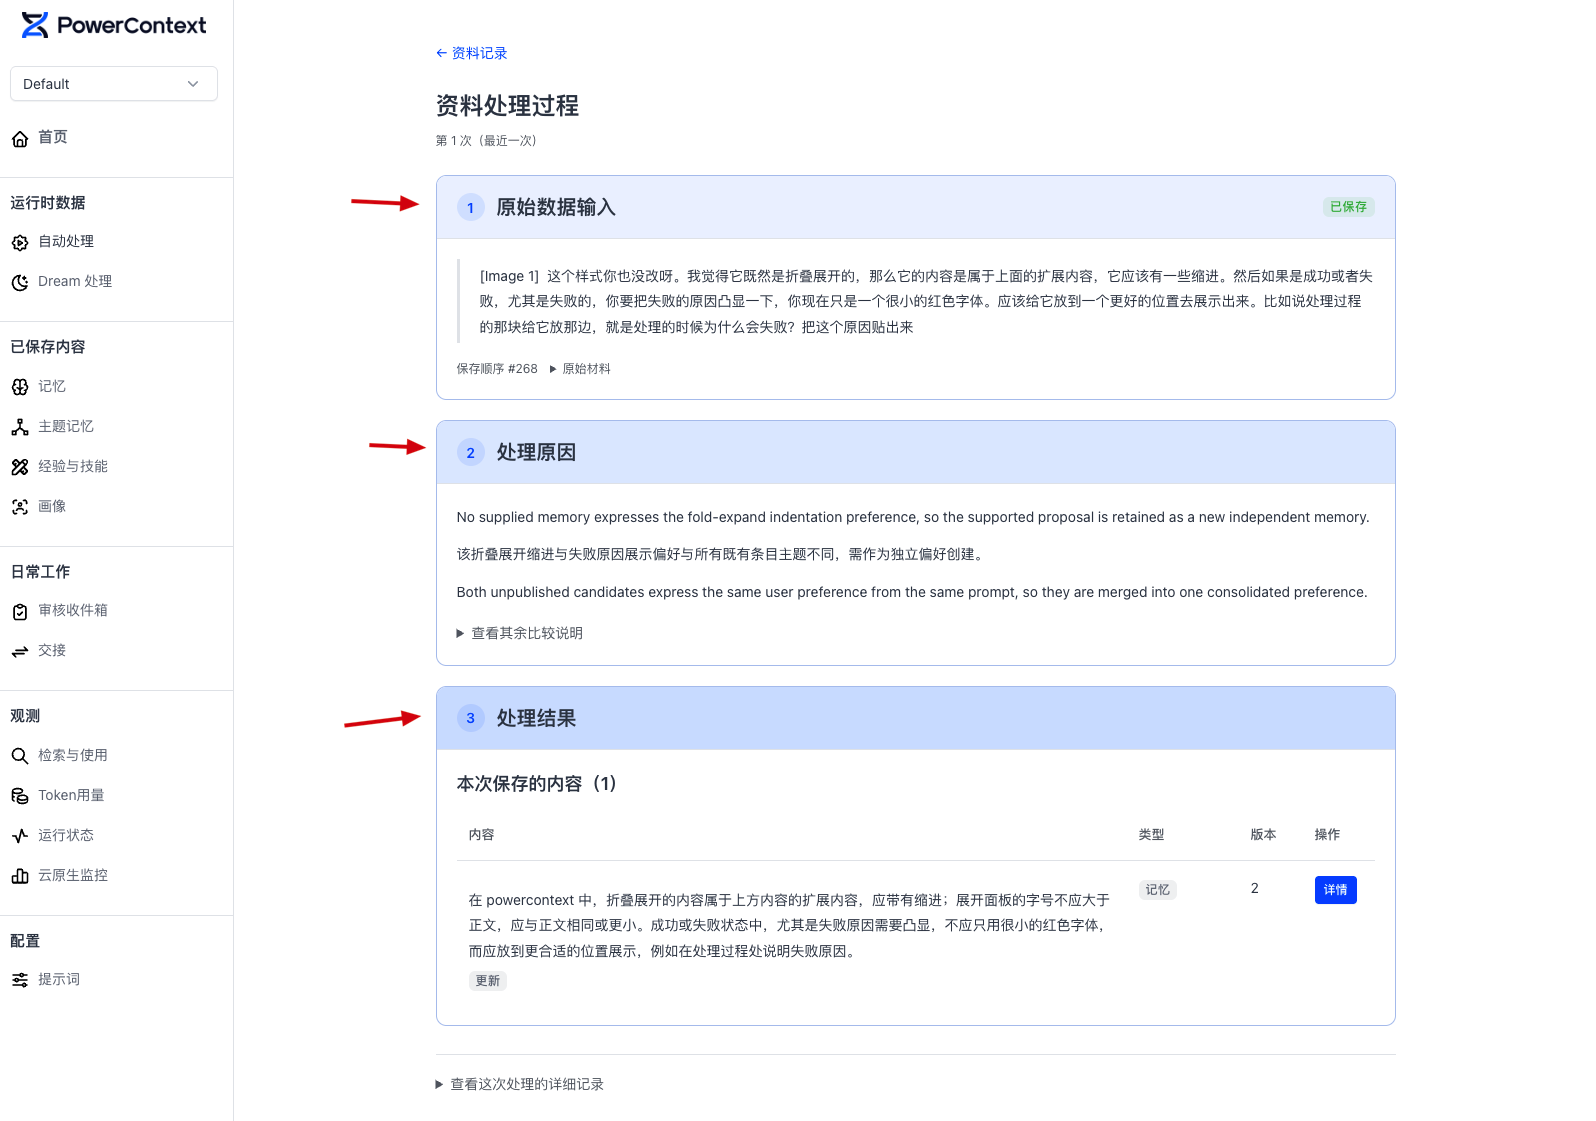
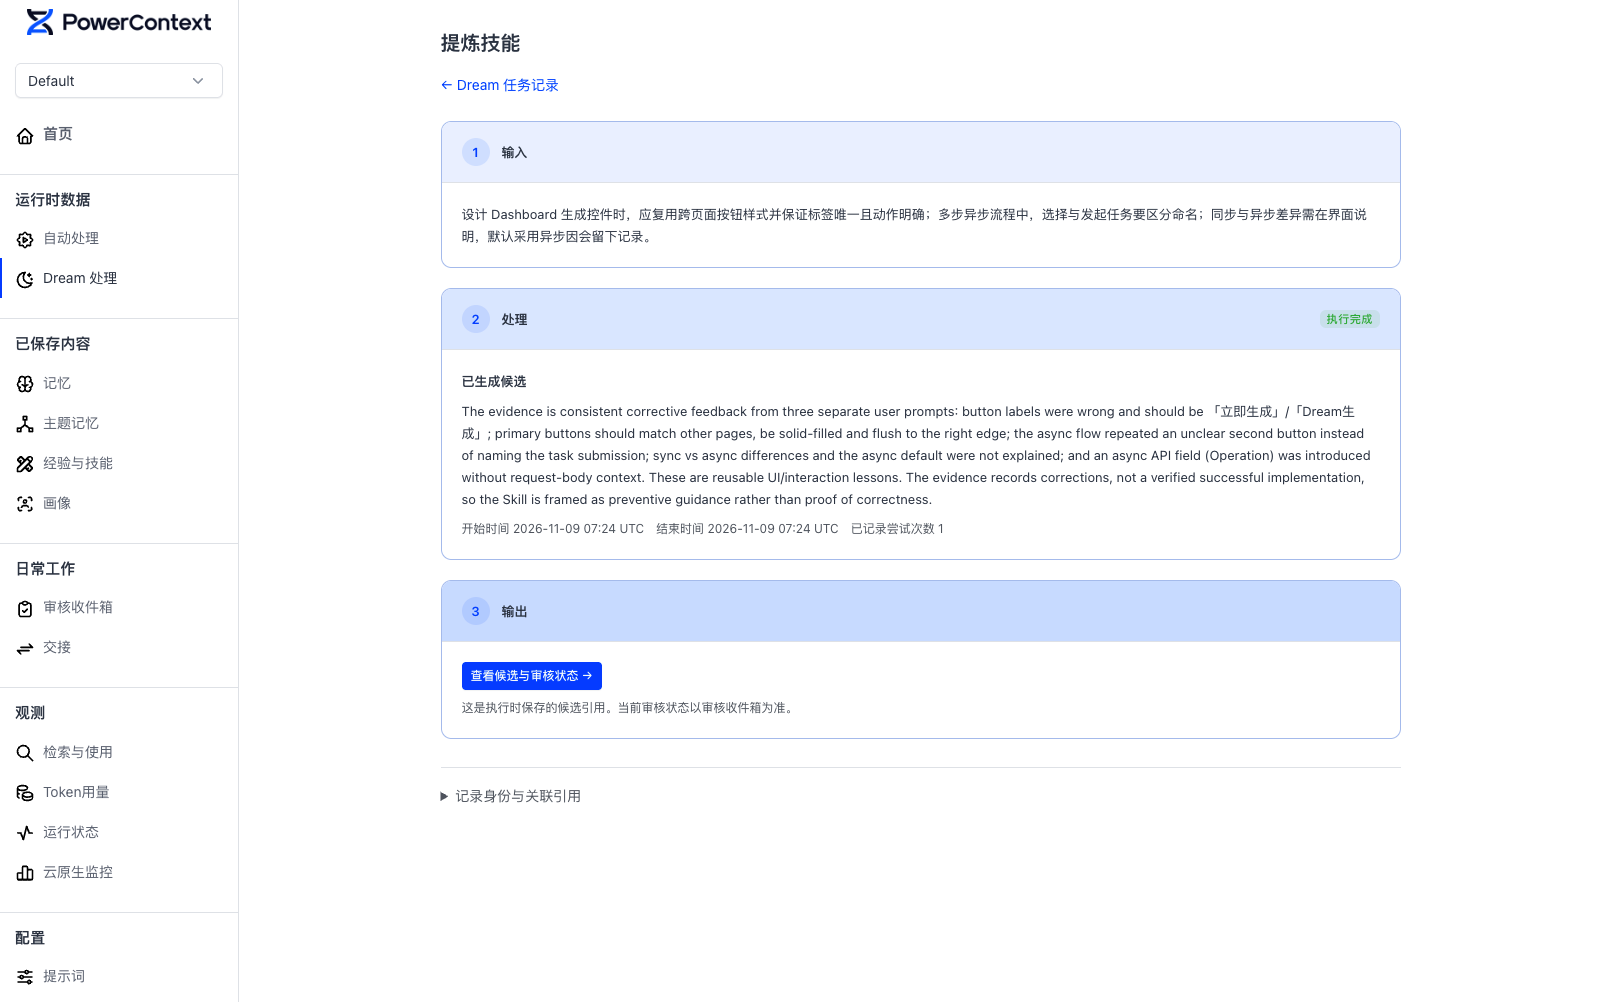
Dream处理流程也做了可视化 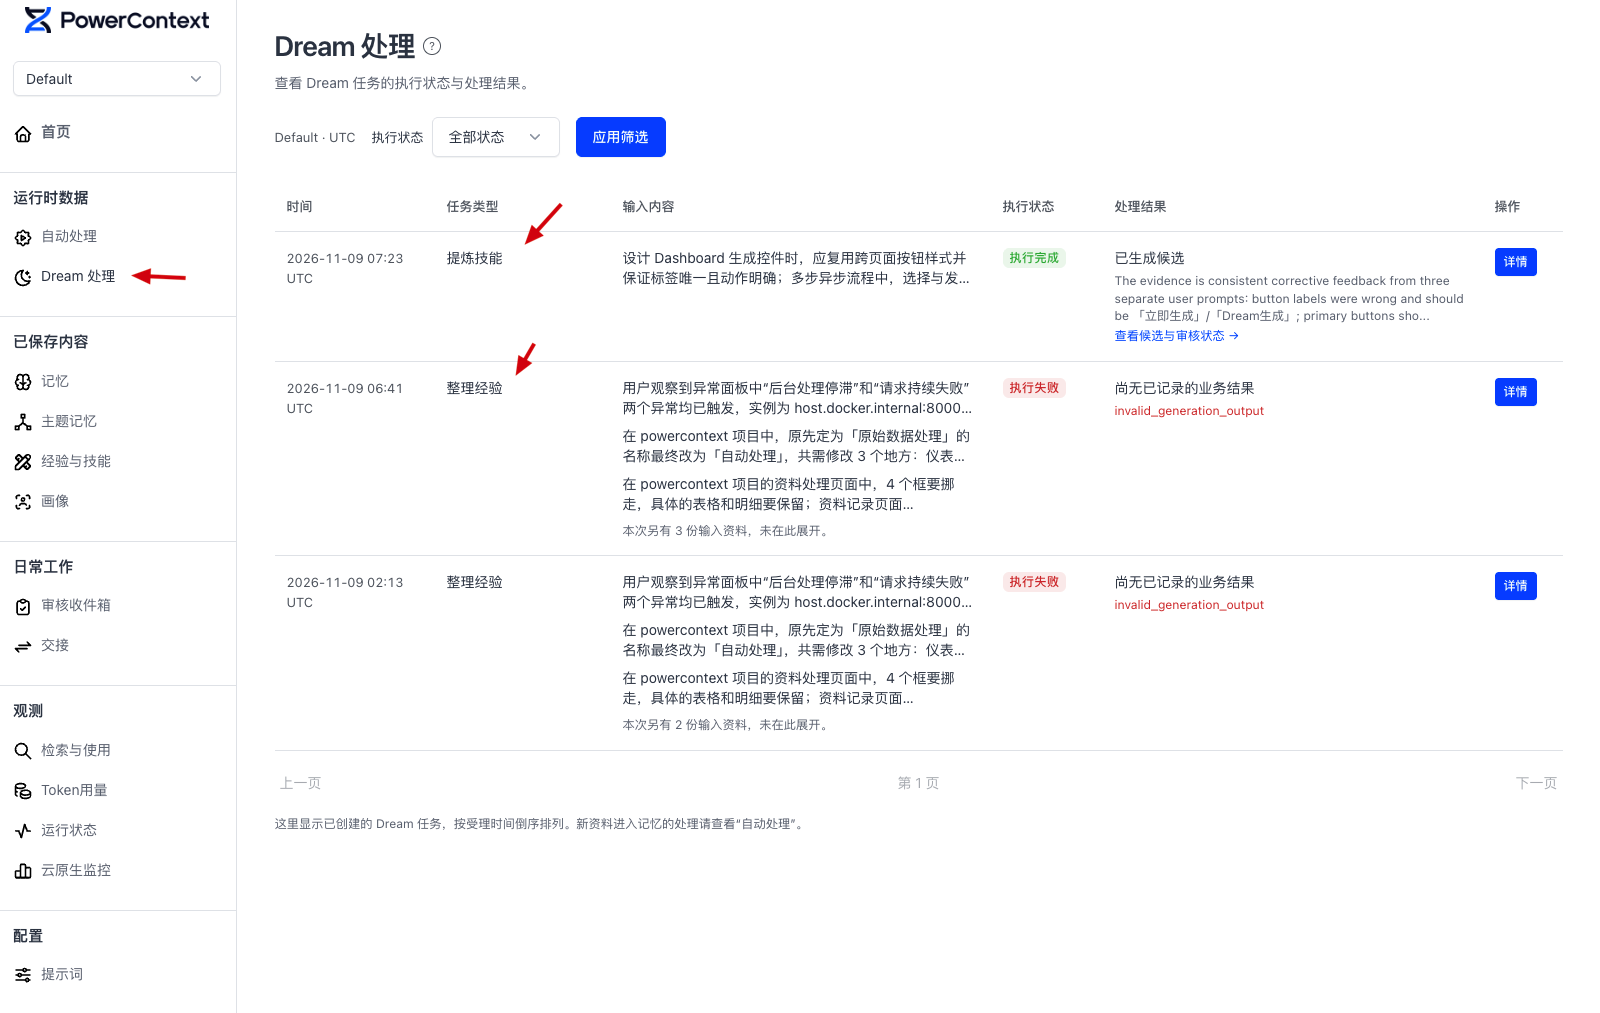
|
技能与经验在页面添加了两个按钮,用来同步生成或者异步生成。否则的话,需要使用命令行或者跟Agent进行对话才能生成,有的时候会忘记。这样的话会有一个显示入口。 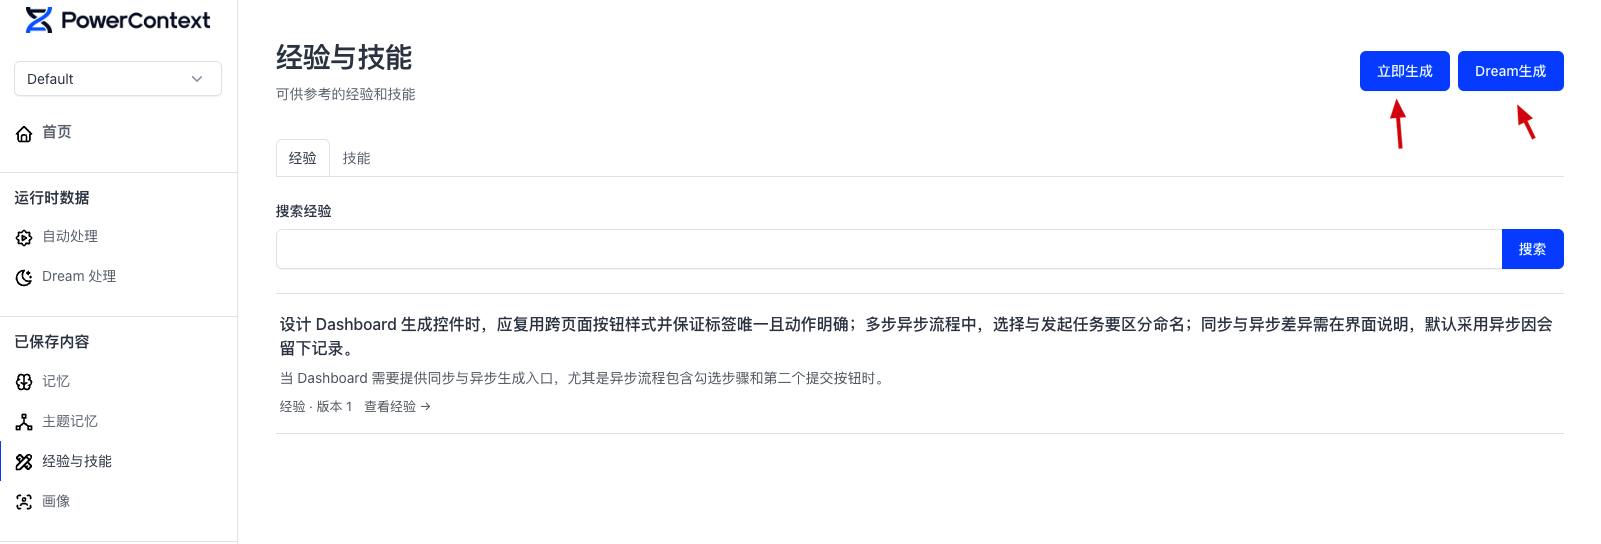
|
检索与使用每一次使用的时候,召回了哪些数据,也做了可视化。 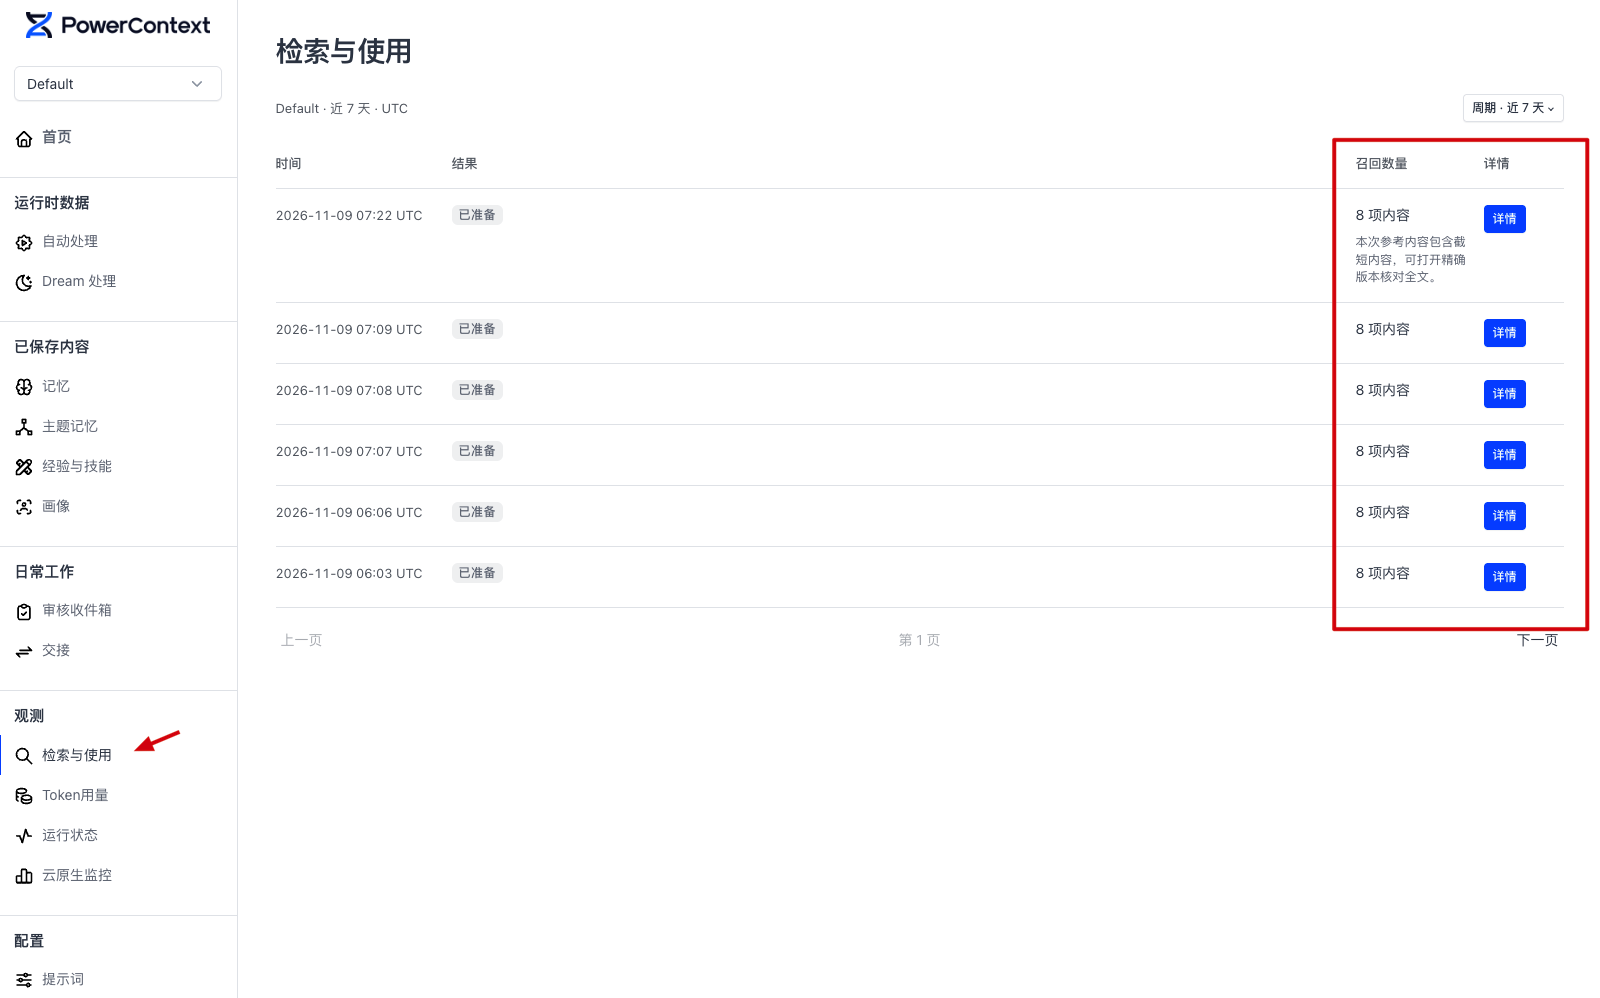
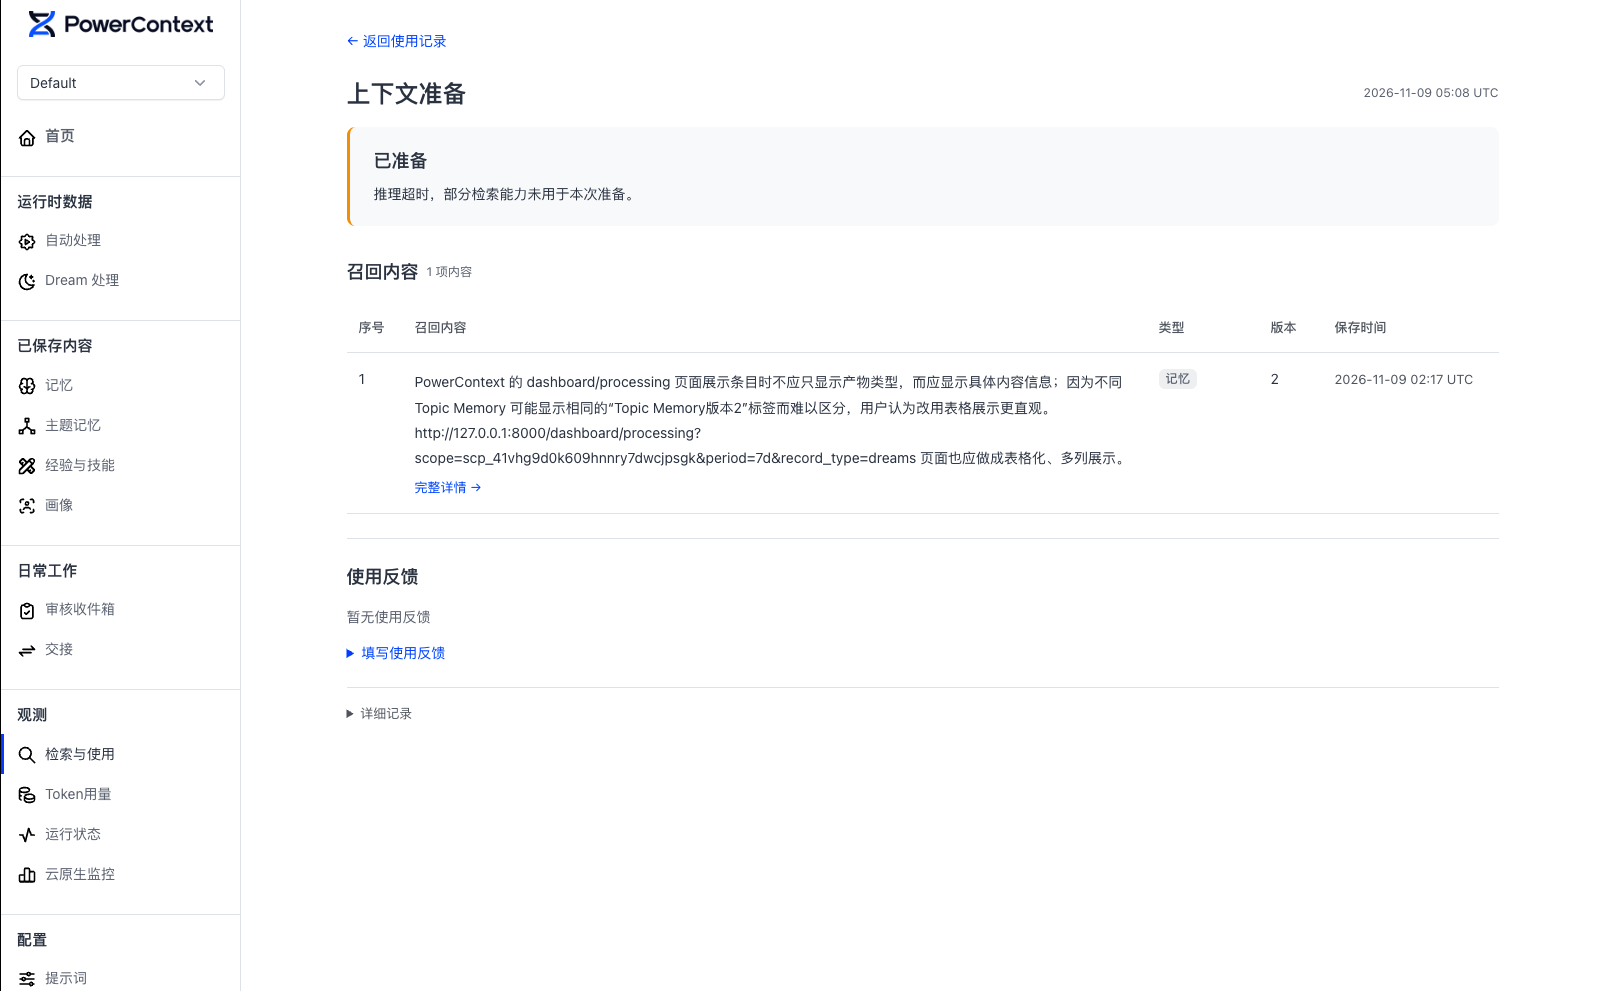
|
观测运行状态新增一个运行状态监控页面,这样的话可以看到开启了哪些功能?这些功能是否有异常?配置的调度时间是多少? 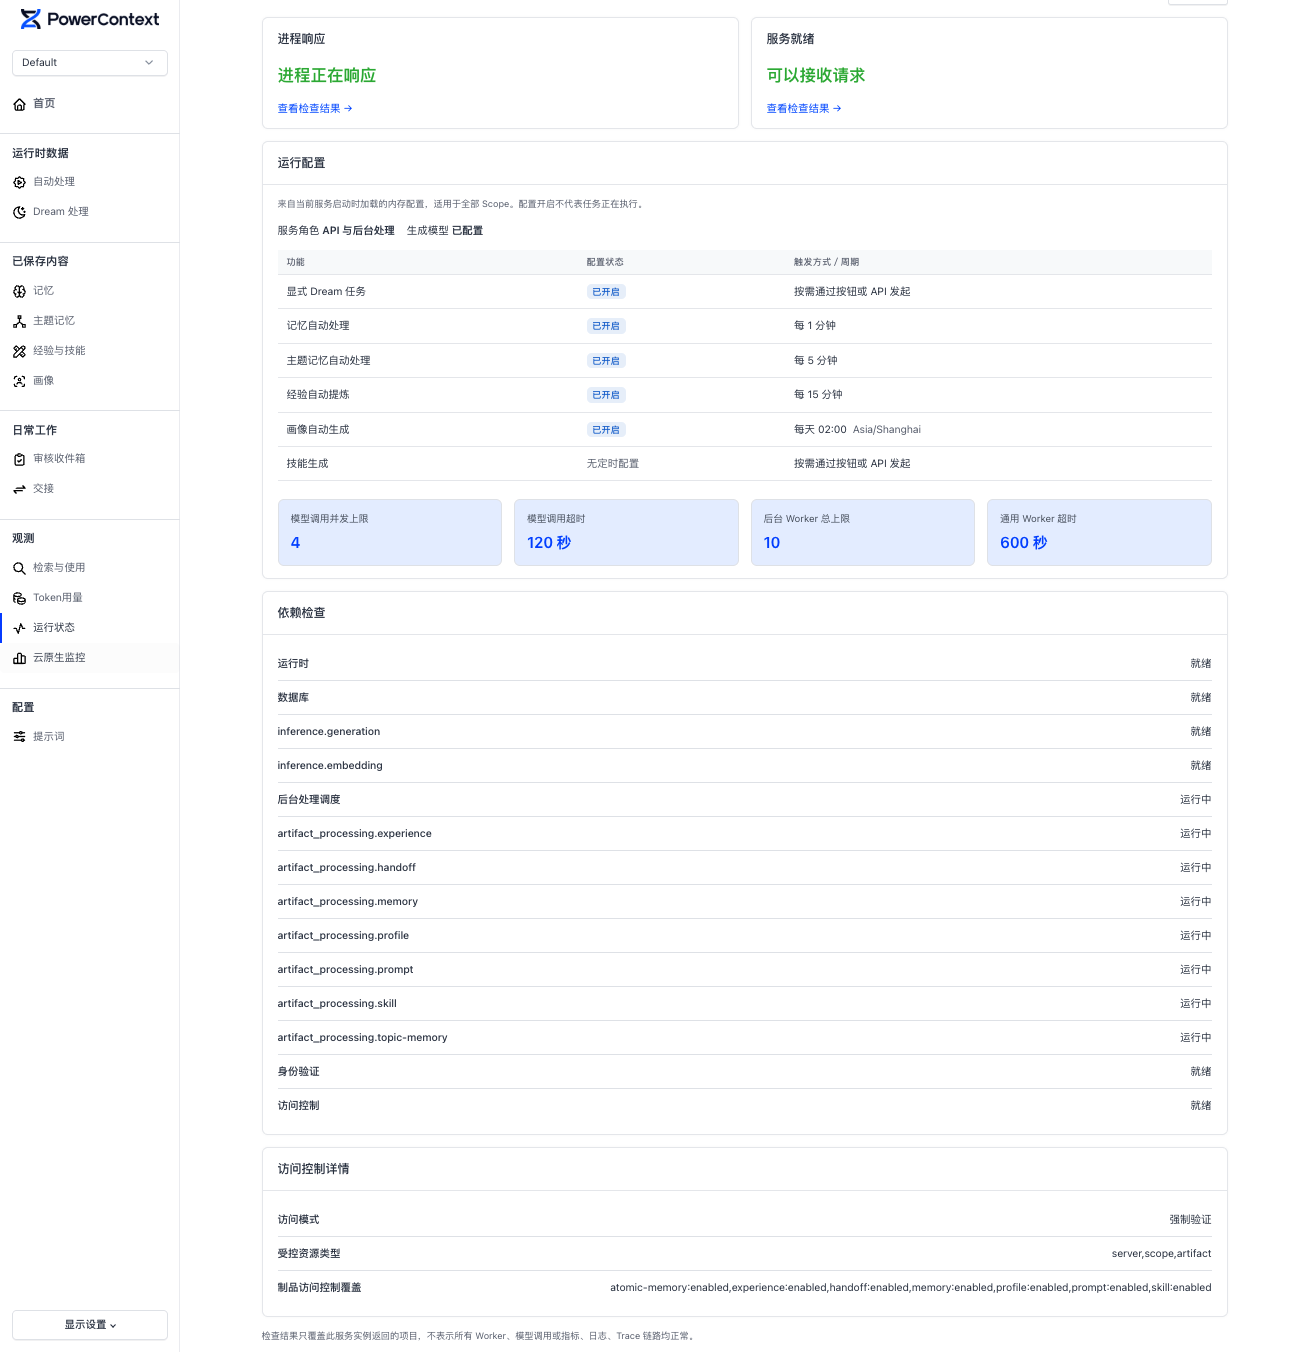
云原生监控为了跟第一步骤做的云原生功能相打通,在这里面加了一个开启引导。 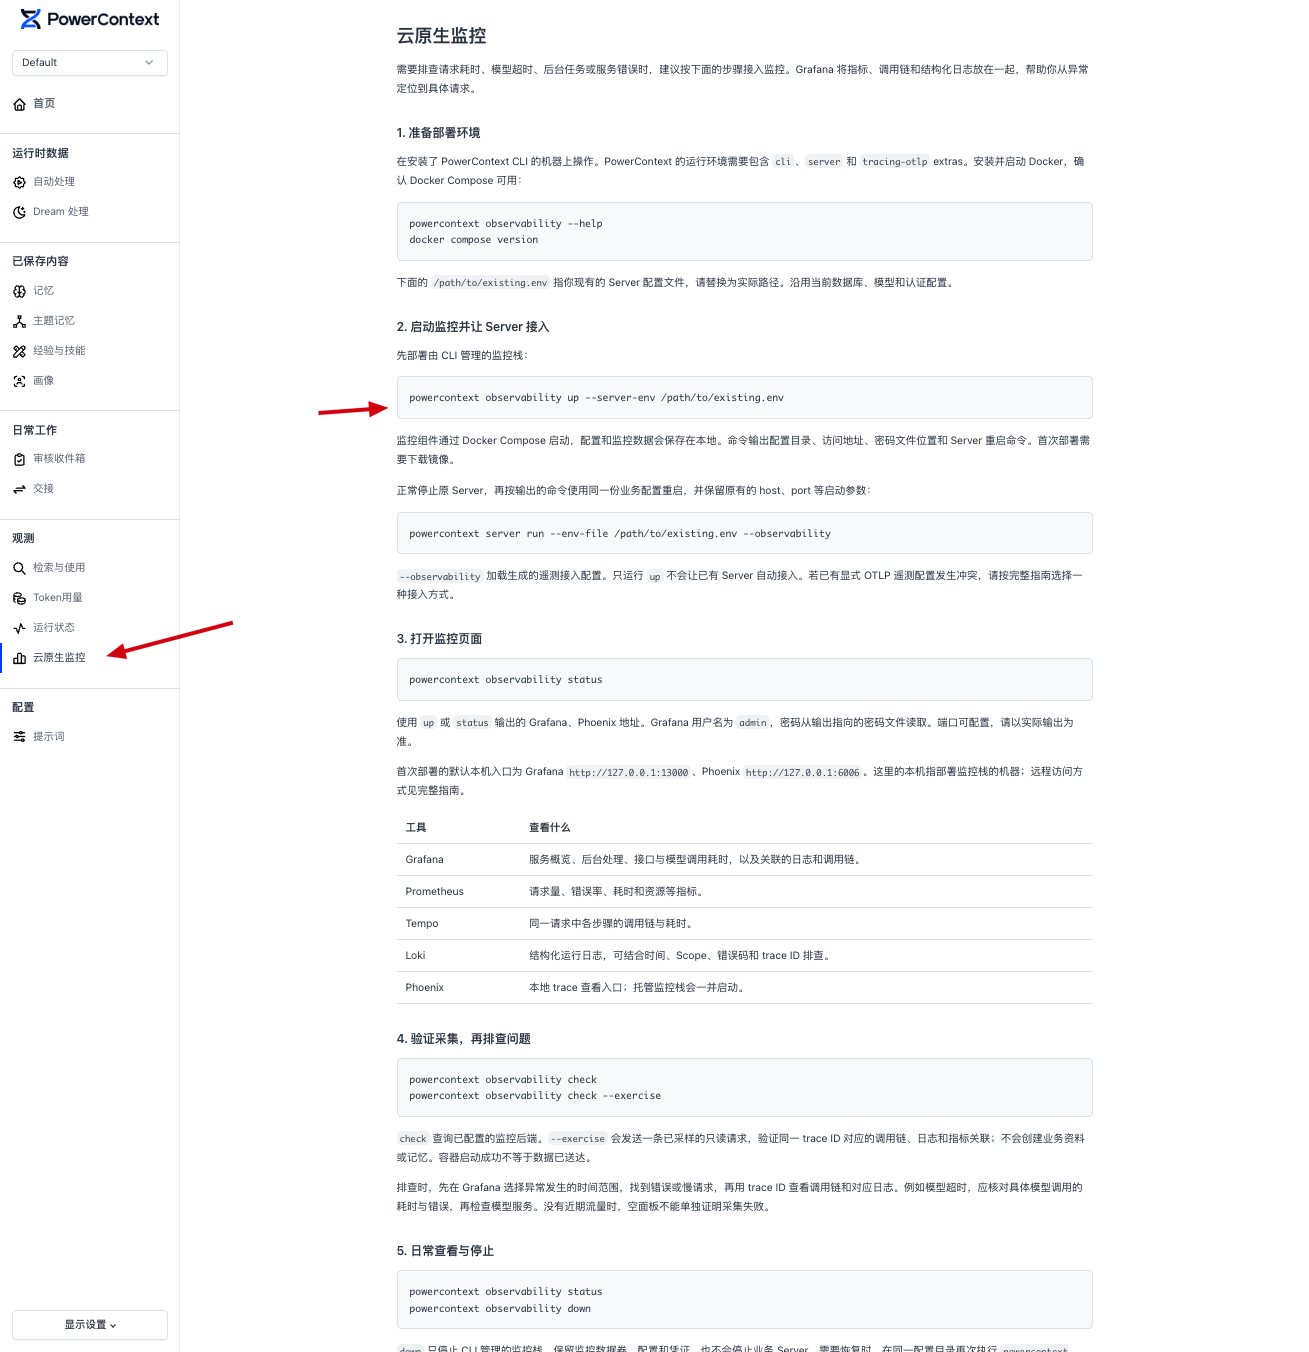
|
Sign up for free
to join this conversation on GitHub.
Already have an account?
Sign in to comment

Uh oh!
There was an error while loading. Please reload this page.
Uh oh!
There was an error while loading. Please reload this page.
背景
为PC Server 添加可观测,包括控制面和数据量两部分
预期
控制面可观测
从服务层面进行数据分析。通过页面可以查看服务性能、定位异常问题(全系统是否正常 → 哪个模块异常 → 影响哪些操作或任务 → 当时发生了什么 → 哪一步失败)
数据面可观测
从业务层面进行数据分析
具体实施步骤
All reactions